Fig. 1
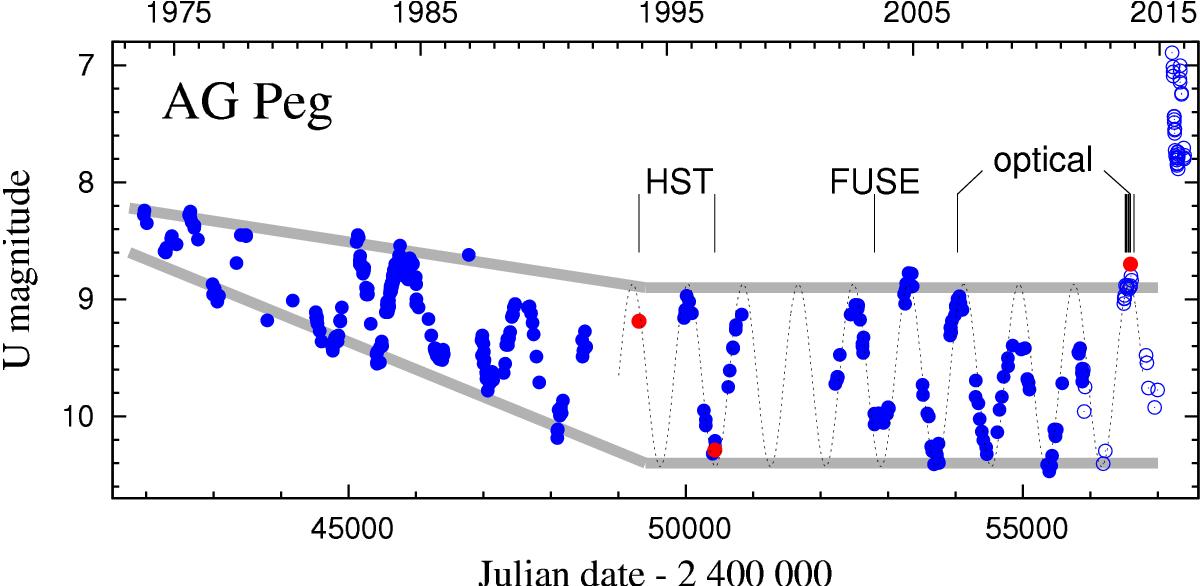
Final stage of the nova-like outburst of AG Peg as demonstrated by the U-LC (blue dots) from 1972 to the present. Vertical lines represent timing of our spectroscopic observations during the quiescent phase. Red dots represent U magnitudes derived from model SEDs (see Sect. 3.2.2). Data are from Belyakina (1992), Mürset & Nussbaumer (1994), Hric et al. (1996), Tomov & Tomova (1998), Skopal et al. (2004), Skopal et al. (2007), Skopal et al. (2012) and this paper (⊙).
Current usage metrics show cumulative count of Article Views (full-text article views including HTML views, PDF and ePub downloads, according to the available data) and Abstracts Views on Vision4Press platform.
Data correspond to usage on the plateform after 2015. The current usage metrics is available 48-96 hours after online publication and is updated daily on week days.
Initial download of the metrics may take a while.