Fig. 8
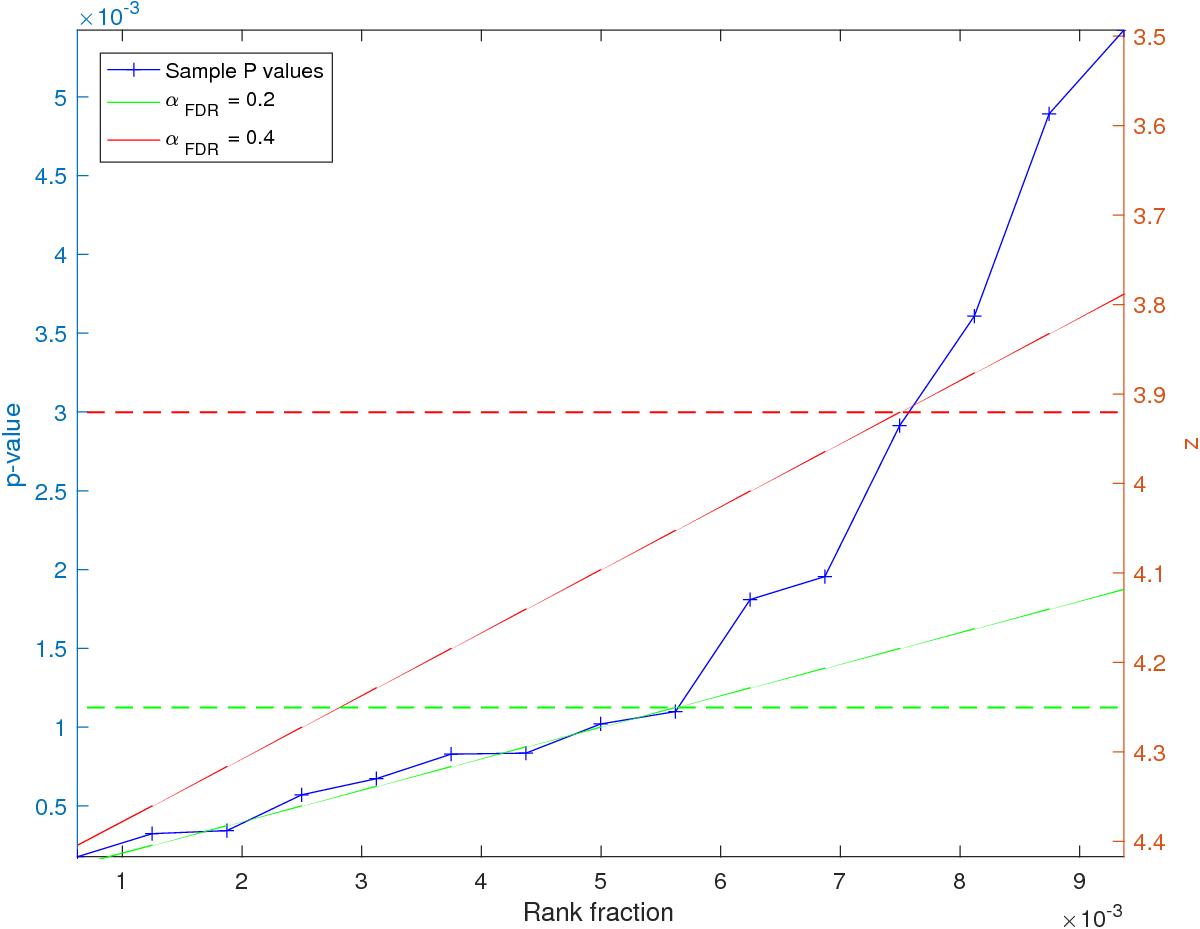
Rank fraction vs. p-values (left axis) and peak amplitudes (right axis) of the peaks in Fig. 3d (see text). Here the p-values correspond to the PFA of the peaks. The dashed lines provide the detection threshold for the corresponding false discovery rate αFDR. Any cross below a detection threshold corresponds to a detection. The detection thresholds are determined by the greatest p-value below the corresponding continuous line (for details, see Miller et al. 2001).
Current usage metrics show cumulative count of Article Views (full-text article views including HTML views, PDF and ePub downloads, according to the available data) and Abstracts Views on Vision4Press platform.
Data correspond to usage on the plateform after 2015. The current usage metrics is available 48-96 hours after online publication and is updated daily on week days.
Initial download of the metrics may take a while.