Fig. 7
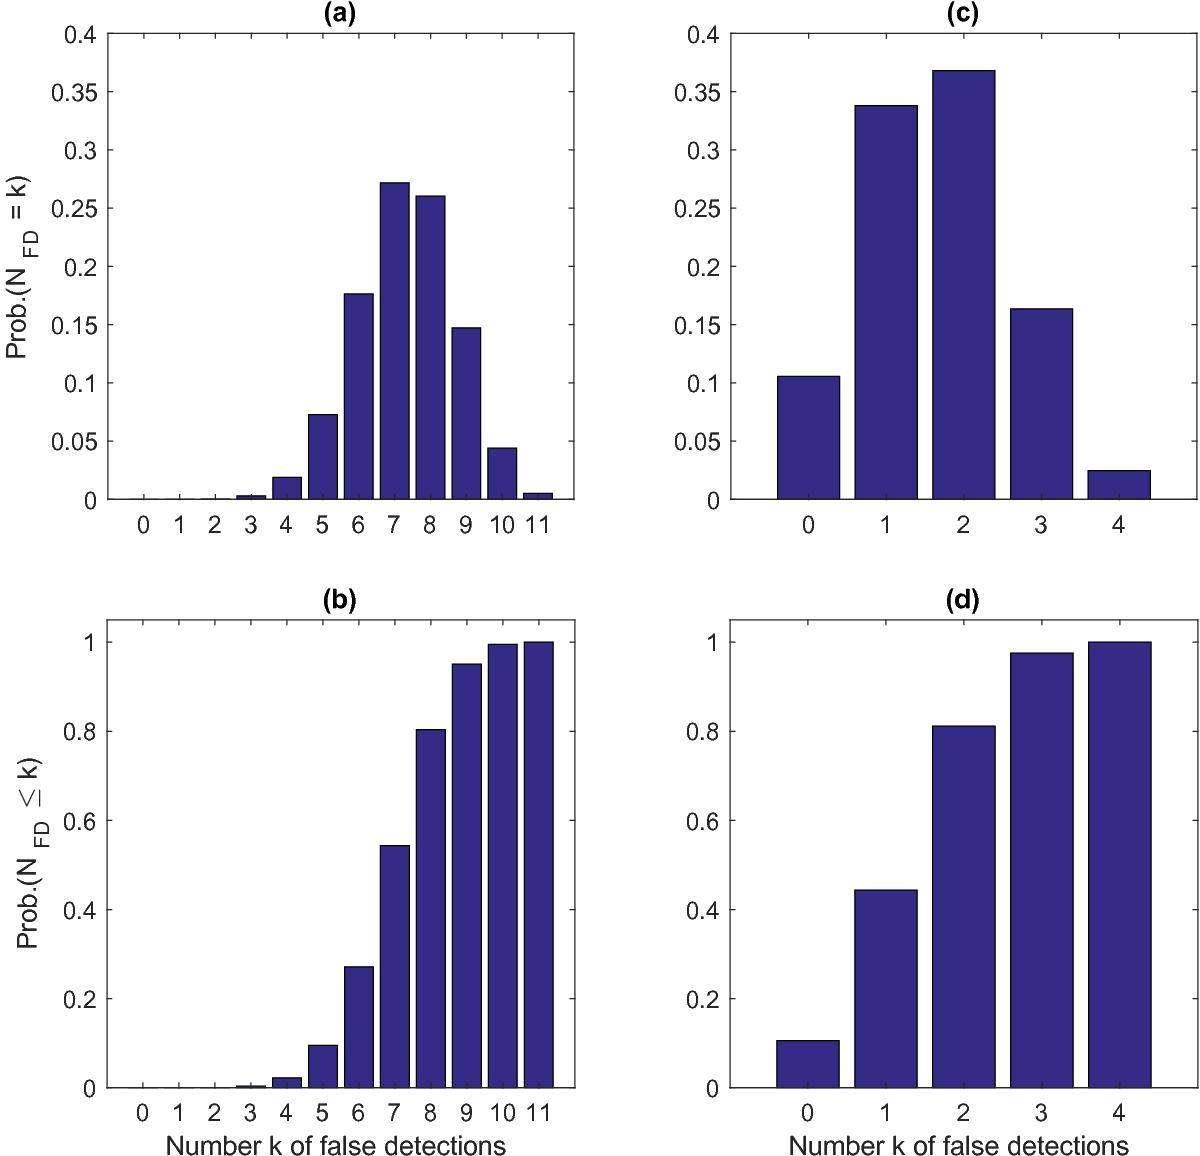
a) Probability distribution function (PDF) of the number NFD of false detections among the peaks #1 – #11 in Fig 6; b) cumulative distribution function (CDF) is shown corresponding to the PDF in the previous panel; c) PDF is shown of the number NFD of false detection among the peaks #8 – #11 in Fig 6; d) CDF is shown corresponding to the PDF in the previous panel.
Current usage metrics show cumulative count of Article Views (full-text article views including HTML views, PDF and ePub downloads, according to the available data) and Abstracts Views on Vision4Press platform.
Data correspond to usage on the plateform after 2015. The current usage metrics is available 48-96 hours after online publication and is updated daily on week days.
Initial download of the metrics may take a while.