Free Access
Fig. 6
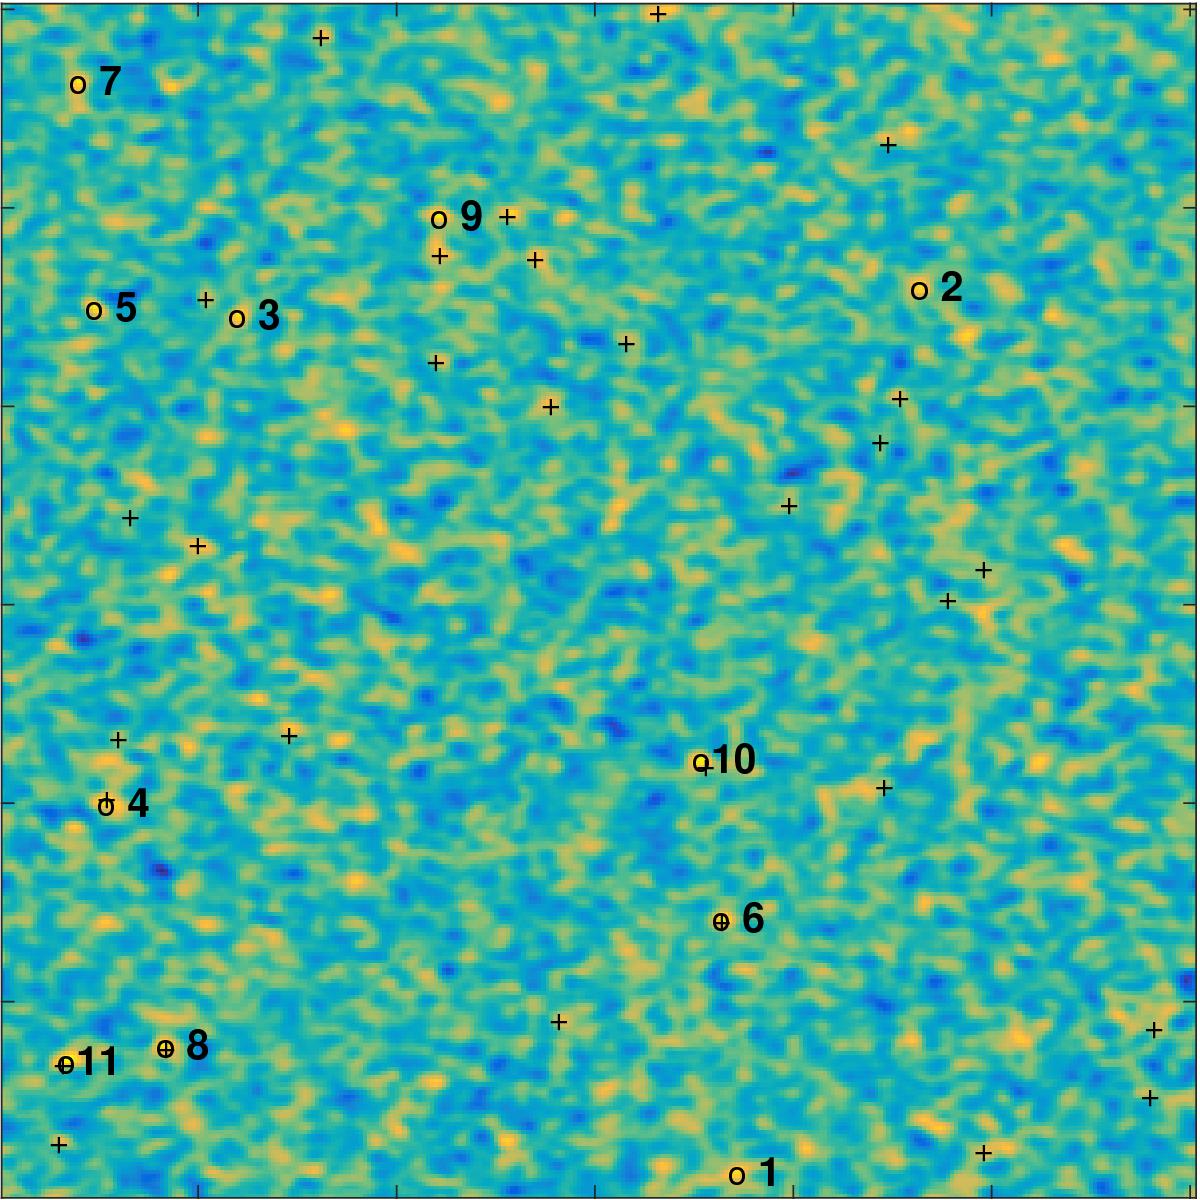
Detection results for the peaks in Fig. 3d. The black circles highlight the peaks with a PFA smaller than 2.55 × 10⁻³. Each of such peaks is indexed with an increasing number according to its amplitude. The black crosses highlight the true position of the point sources.
Current usage metrics show cumulative count of Article Views (full-text article views including HTML views, PDF and ePub downloads, according to the available data) and Abstracts Views on Vision4Press platform.
Data correspond to usage on the plateform after 2015. The current usage metrics is available 48-96 hours after online publication and is updated daily on week days.
Initial download of the metrics may take a while.