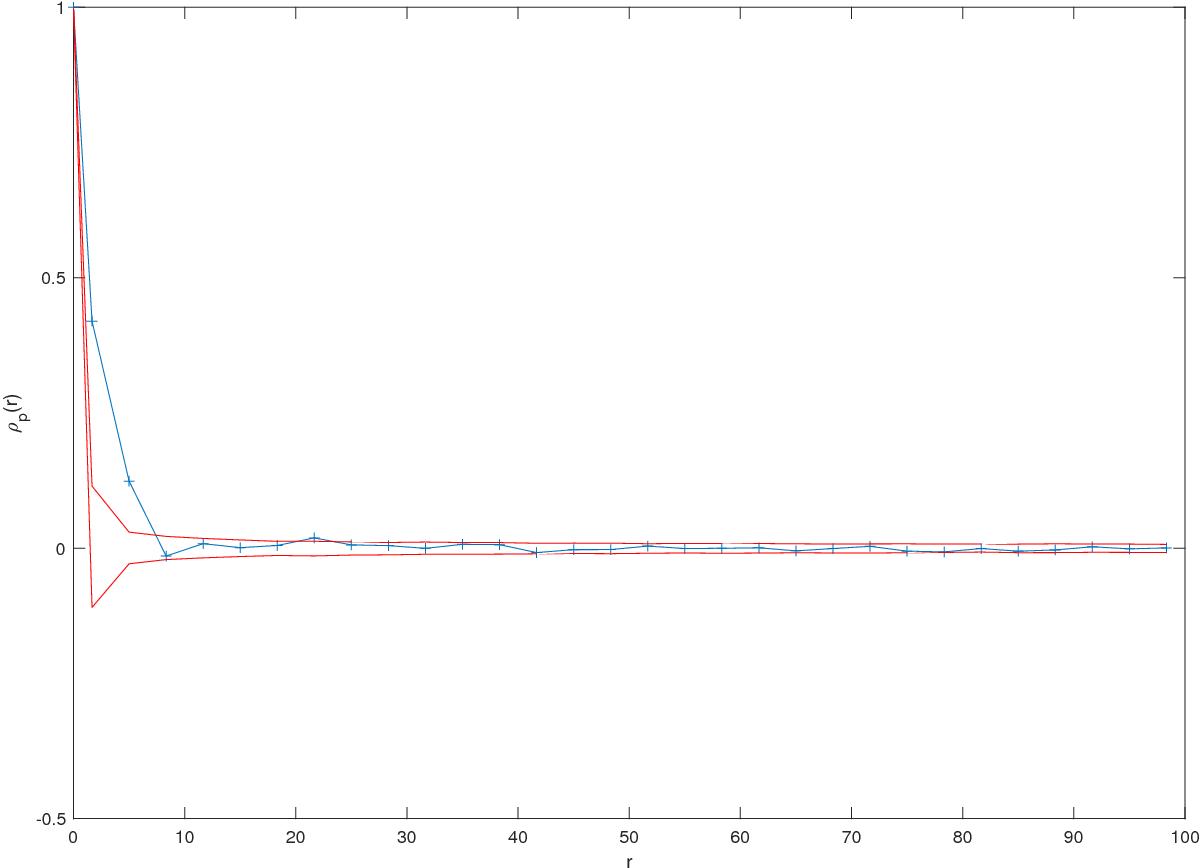
Fig. 5

Two-point correlation function ρp(r) for the peaks in Fig. 3d. The inter-point distance r is in pixels units. The two red lines define the 95% confidence band. They were obtained by means of a bootstrap method based on the 95% percentile envelopes of the two-point correlation functions obtained from 1000 resampled sets of peaks with the same spatial coordinates as in the original signal but whose values were randomly permuted.
Current usage metrics show cumulative count of Article Views (full-text article views including HTML views, PDF and ePub downloads, according to the available data) and Abstracts Views on Vision4Press platform.
Data correspond to usage on the plateform after 2015. The current usage metrics is available 48-96 hours after online publication and is updated daily on week days.
Initial download of the metrics may take a while.


