Free Access
Fig. 4
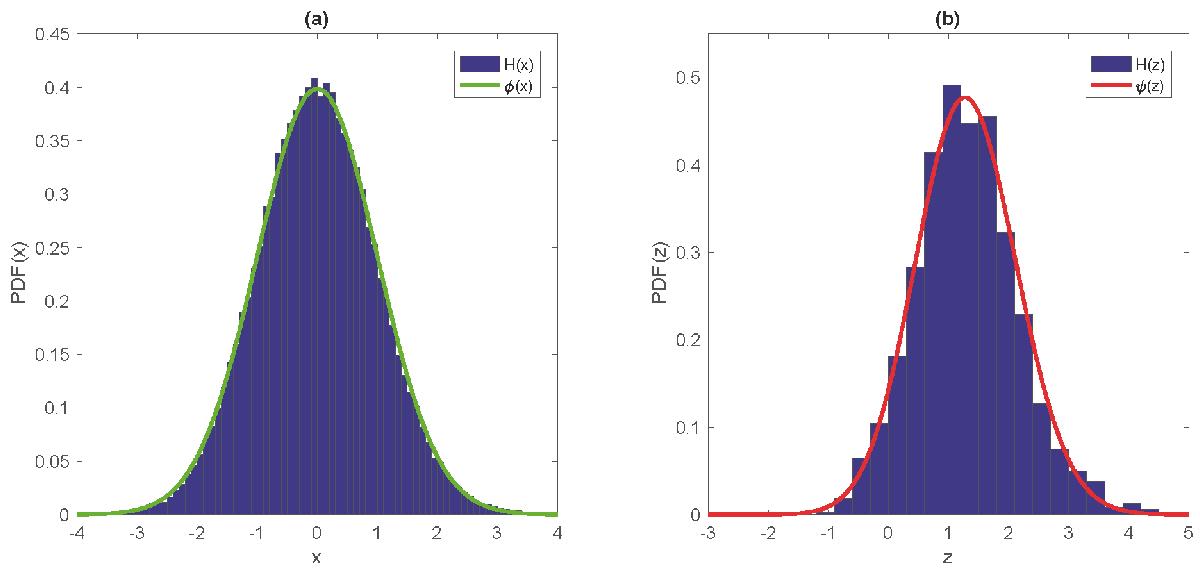
a) Histogram H(x) of the pixel values of the map in Fig. 3d. For reference, the standard Gaussian PDF φ(x) is also plotted; b) histogram H(z) of the values of the peaks in the same map vs. the corresponding PDF ψ(z) is shown. There is good agreement between φ(x) and ψ(x) with the corresponding histograms.
Current usage metrics show cumulative count of Article Views (full-text article views including HTML views, PDF and ePub downloads, according to the available data) and Abstracts Views on Vision4Press platform.
Data correspond to usage on the plateform after 2015. The current usage metrics is available 48-96 hours after online publication and is updated daily on week days.
Initial download of the metrics may take a while.