Fig. 17
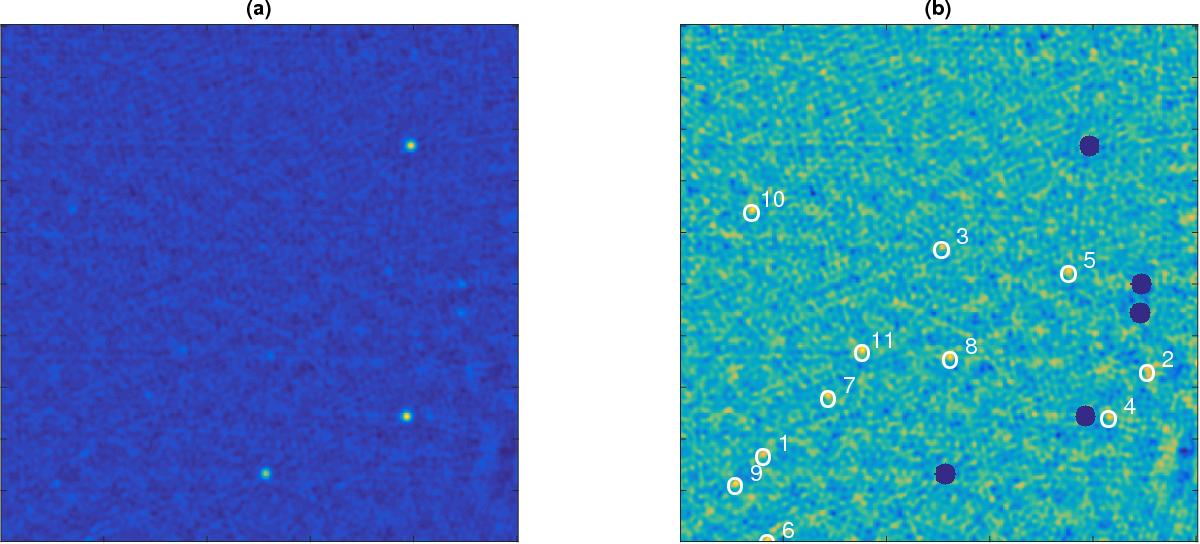
a) Original ATCA 500 × 500 pixels sub-image, standardized to zero mean and unit variance, used for the detection of the point sources; b) same image with the brightest sources masked (blue circles) and the detected point sources are indicated with white circles and indexed with an increasing number according to the source amplitude.
Current usage metrics show cumulative count of Article Views (full-text article views including HTML views, PDF and ePub downloads, according to the available data) and Abstracts Views on Vision4Press platform.
Data correspond to usage on the plateform after 2015. The current usage metrics is available 48-96 hours after online publication and is updated daily on week days.
Initial download of the metrics may take a while.