Fig. 14
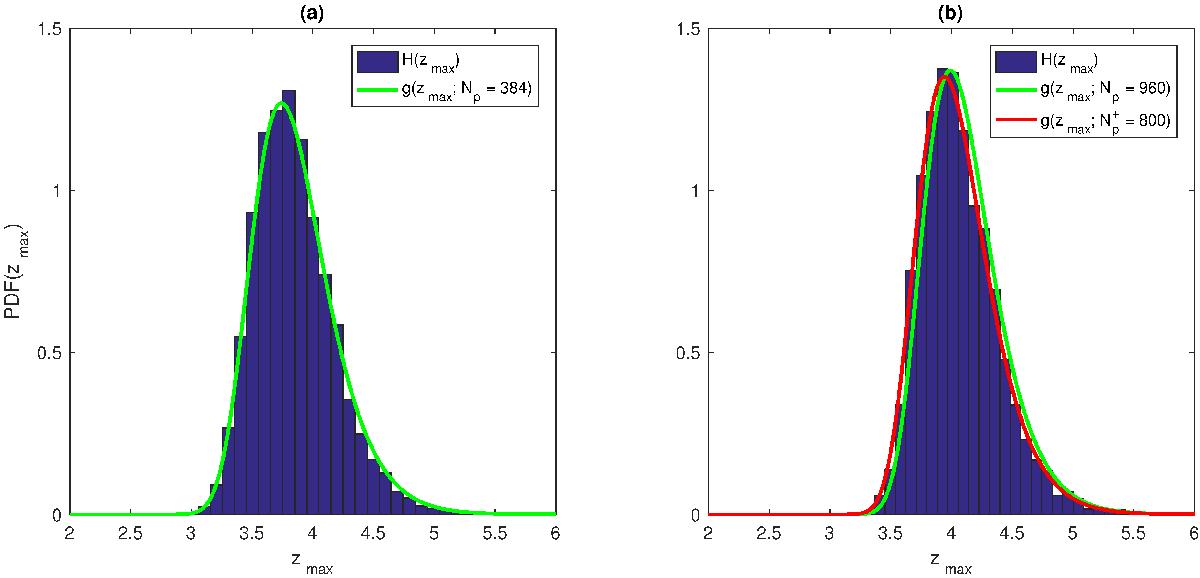
a)–b) Histograms vs. the PDFs g(zmax) of the largest peak value from 5000 Gaussian random fields obtained by filtering a 256 × 256 discrete white noise map by means of a Gaussian filter with dispersion of 3.7 and 2.7 pixels in such a way as to reproduce approximately the noise in M1 and M2, respectively. Since each simulated map is characterized by a different number of peaks, the corresponding PDFs are slightly different from one another. For this reason, the displayed g(zmax) plotted in green corresponds to the mean number of peaks which are 384 and 960, respectively. In panel b the resulting PDF is in reasonably good agreement with the corresponding histogram, but a better result is obtainable if an effective number ![]() is used. To stress the fact that, although
is used. To stress the fact that, although ![]() is about 17% smaller than Np, the resulting PDF is only slightly different. All this is in accordance with the arguments in Sect. 3.
is about 17% smaller than Np, the resulting PDF is only slightly different. All this is in accordance with the arguments in Sect. 3.
Current usage metrics show cumulative count of Article Views (full-text article views including HTML views, PDF and ePub downloads, according to the available data) and Abstracts Views on Vision4Press platform.
Data correspond to usage on the plateform after 2015. The current usage metrics is available 48-96 hours after online publication and is updated daily on week days.
Initial download of the metrics may take a while.