Fig. 10
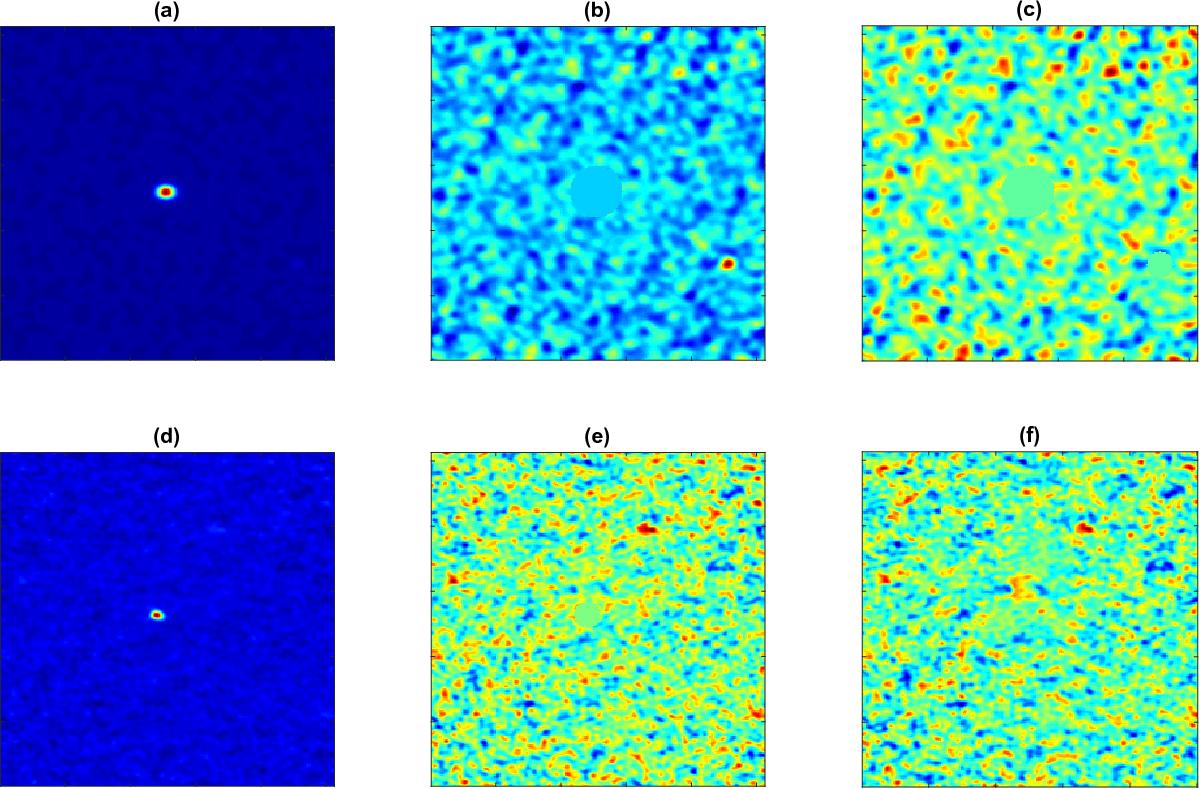
a) Original ALMA map M1 is shown; b) map M1 with the brightest sources masked is shown; c) map M1 with both brightest sources masked is shown; d) original ALMA map M2 is shown; e) map M2 with the brightest sources masked is shown; f) map M3, obtained by composing M1 and M2 with the Feather algorithm implemented in CASA, is shown.
Current usage metrics show cumulative count of Article Views (full-text article views including HTML views, PDF and ePub downloads, according to the available data) and Abstracts Views on Vision4Press platform.
Data correspond to usage on the plateform after 2015. The current usage metrics is available 48-96 hours after online publication and is updated daily on week days.
Initial download of the metrics may take a while.