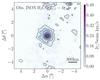
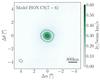
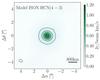
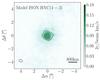
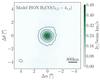
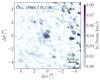
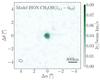
Fig. 2
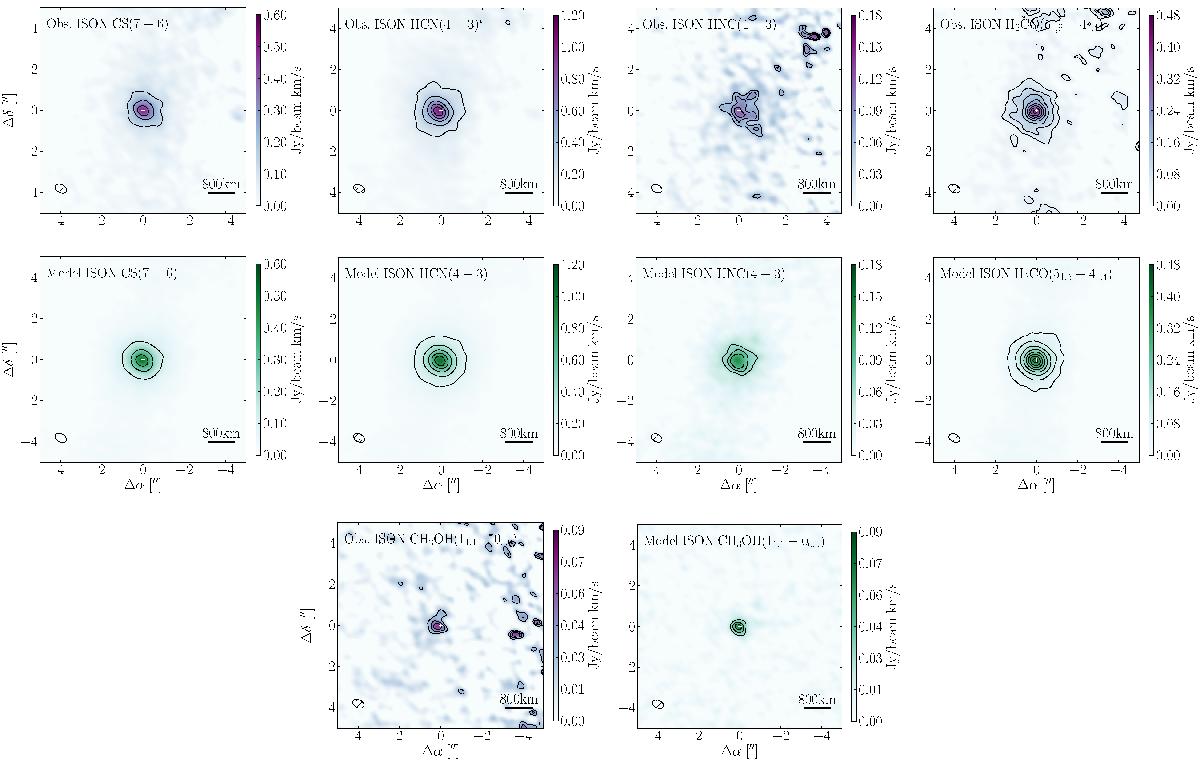
Velocity integrated intensity maps (contours and colour) of CS(7–6), HCN(4–3), HNC(4–3), H2CO(51,5–41,4) and CH3OH(11,1–00,0) detected in the coma of comet ISON in blue and model counterparts (Sect. 4) in green. Colours indicate intensity and contours are in steps of 10σ for CS(7–6) and HCN(4–3), 3σ for H2CO(51,5–41,4) and 1σ for HNC(4–3) and CH3OH(11,1–00,0) starting at 3σ and 2σ respectively where σ is the RMS noise in each map. Crosses mark the peak continuum emission.
Current usage metrics show cumulative count of Article Views (full-text article views including HTML views, PDF and ePub downloads, according to the available data) and Abstracts Views on Vision4Press platform.
Data correspond to usage on the plateform after 2015. The current usage metrics is available 48-96 hours after online publication and is updated daily on week days.
Initial download of the metrics may take a while.