Fig. 6
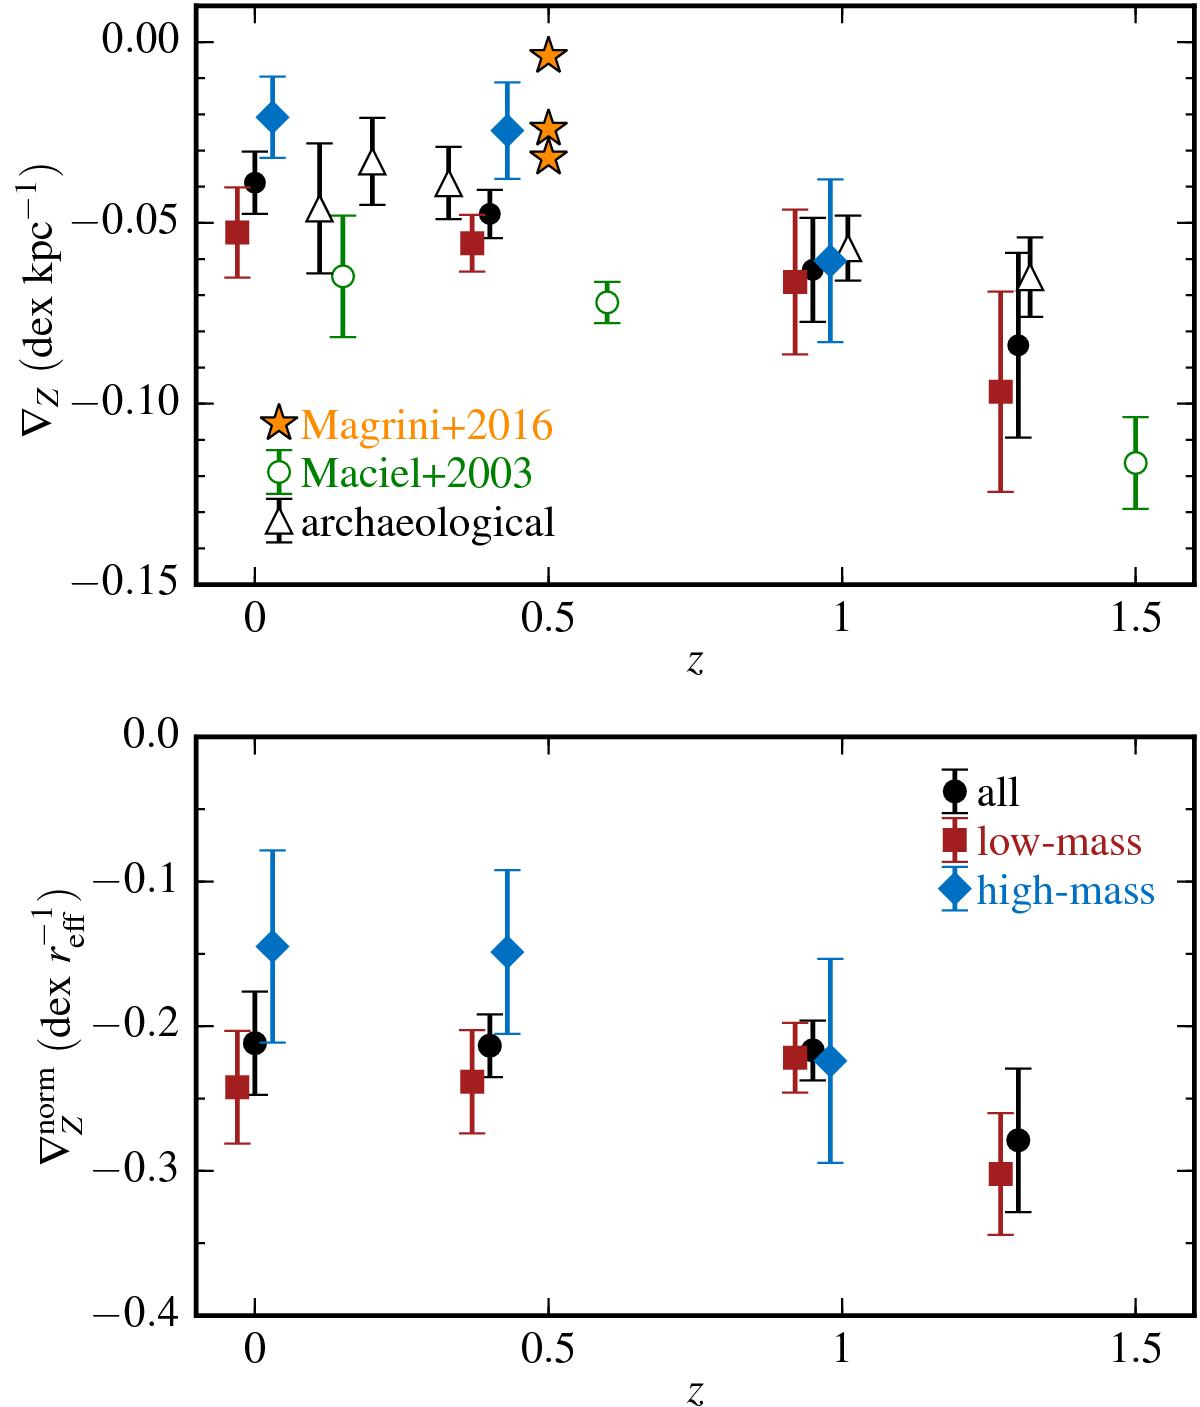
Evolution of the stellar metallicity gradients. Upper panel: median slopes of the metallicity profiles for all simulated discs (black circles) and for those in the low-mass (red squares) and high-mass (blue diamonds) subsamples as a function of redshift. For comparison we include the observational estimations reported by Maciel et al. (2003) for the Milky Way (green open circles) and by Magrini et al. (2016; orange stars) for nearby galaxies. Estimations of the median metallicity gradients (open triangles) performed using the ages and spatial distributions of stars at z ~ 0 are included (see text for details). Lower panel: similar estimations for the normalised metallicity gradients. In both panels, the error bars are estimated using a bootstrap technique. For the sake of clarity, the simulation points are slightly offset horizontally in both panels.
Current usage metrics show cumulative count of Article Views (full-text article views including HTML views, PDF and ePub downloads, according to the available data) and Abstracts Views on Vision4Press platform.
Data correspond to usage on the plateform after 2015. The current usage metrics is available 48-96 hours after online publication and is updated daily on week days.
Initial download of the metrics may take a while.