Fig. 9
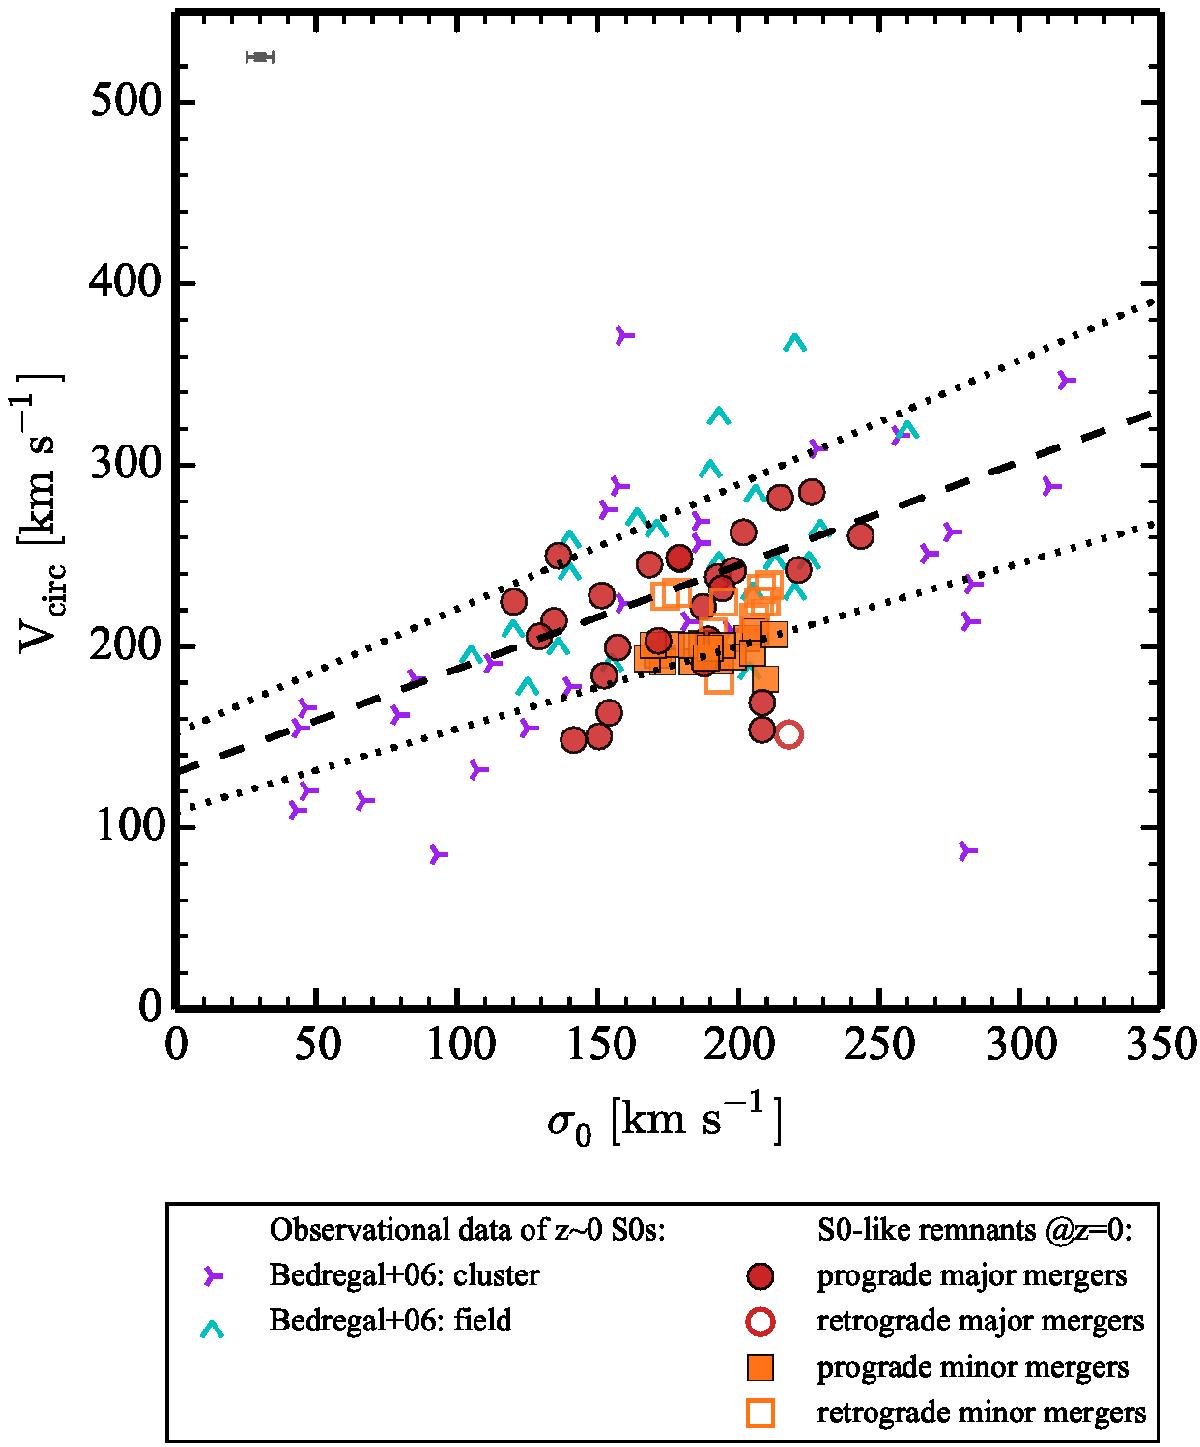
Circular velocity as a function of the central velocity dispersion for our S0-like remnants in comparison with the local S0 galaxies by Bedregal et al. (2006), distinguishing the environment in which they are located. The dashed line corresponds to a linear fit to the whole sample of local S0s and the dotted lines represent the minimum and maximum slopes according to the errors of the fit. The error bars in the upper left corner correspond to the median of the errors in both axes.
Current usage metrics show cumulative count of Article Views (full-text article views including HTML views, PDF and ePub downloads, according to the available data) and Abstracts Views on Vision4Press platform.
Data correspond to usage on the plateform after 2015. The current usage metrics is available 48-96 hours after online publication and is updated daily on week days.
Initial download of the metrics may take a while.