Fig. 7
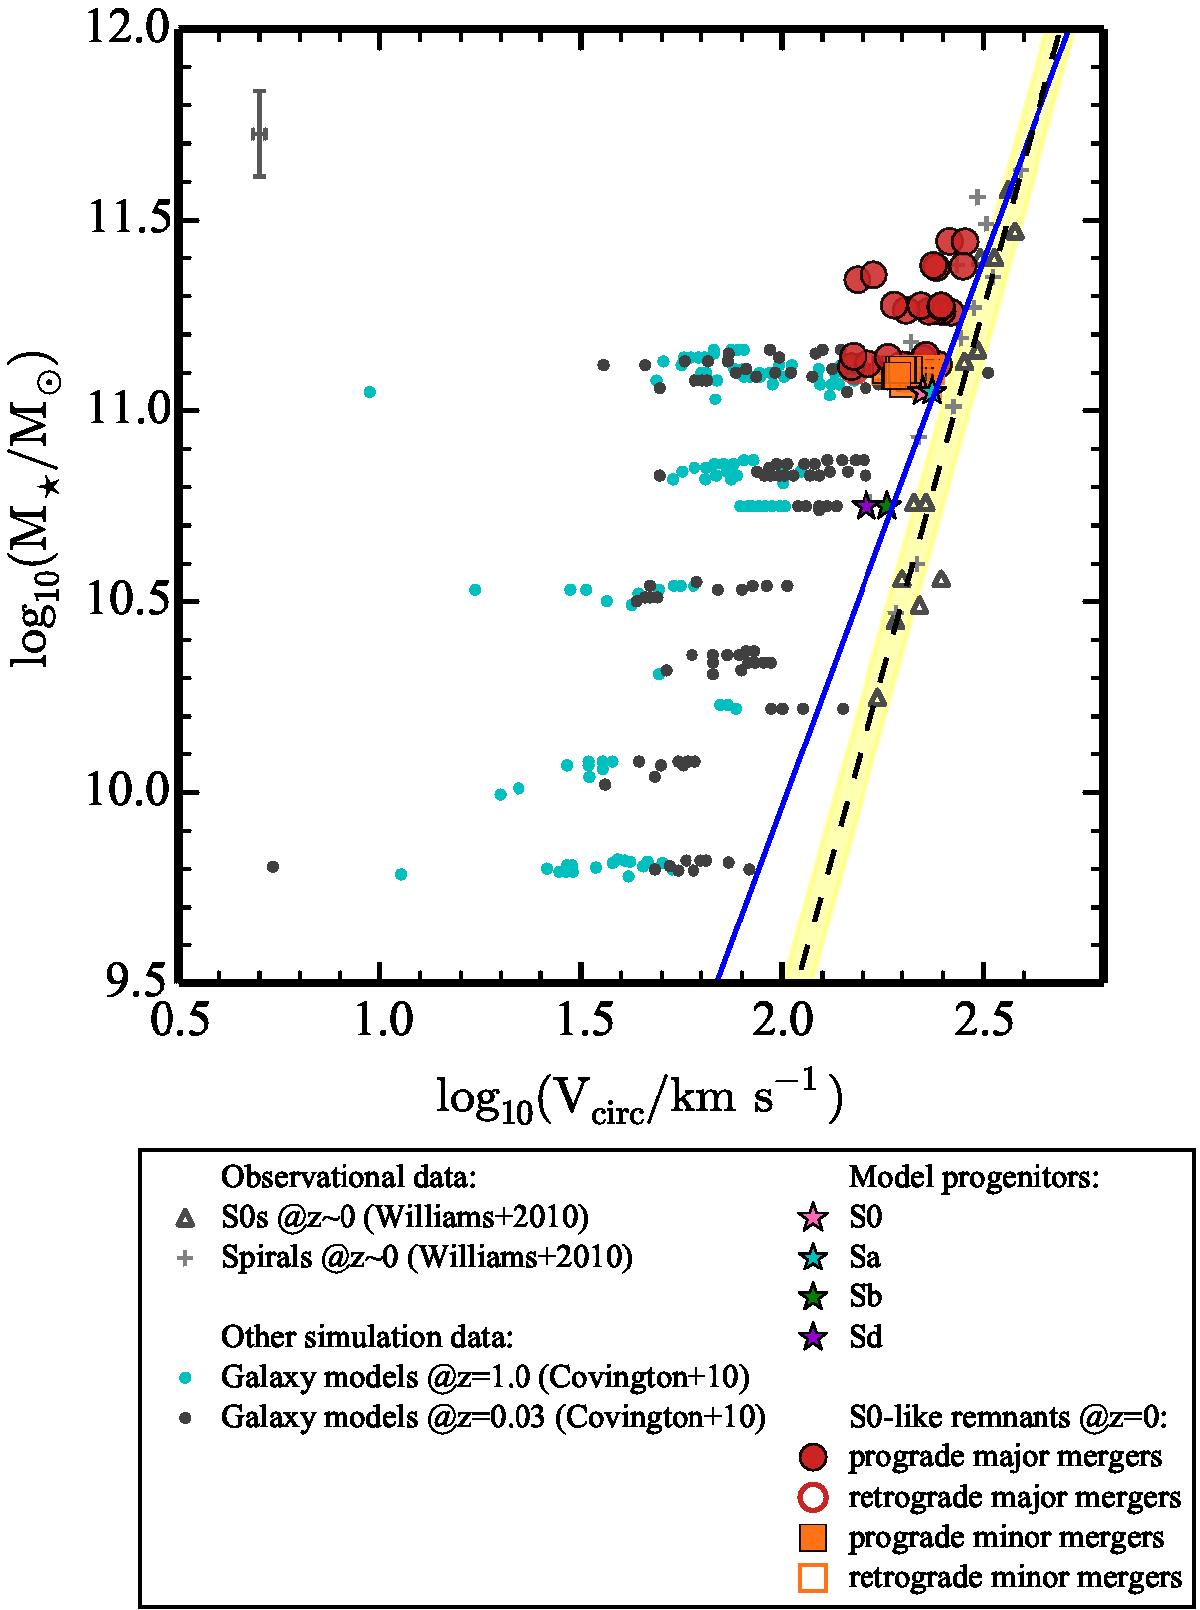
Stellar TFR for the S0-like remnants using Vcirc, compared to the observational data of S0s and spirals by Williams et al. (2010a), and the distribution of mock observations of on-going and remnants of mergers by Covington et al. (2010). For the latter, the data points correspond to Vrot,max measurements. We have overplotted the location of the giant progenitors of our merger experiments (gS0, gSa, gSb, and gSd) to show that they satisfy this local relation. We note that the gS0 and gSa models practically overlap in this diagram. The dashed line corresponds to a linear fit to the S0s by Williams et al. (2010a) and the yellow band represents its 1σ scatter. The blue line denotes the local stellar TFR of spiral galaxies by Williams et al. (2010a). The error bars in the upper left corner correspond to the median of the errors in both axes (see the legend below the figure).
Current usage metrics show cumulative count of Article Views (full-text article views including HTML views, PDF and ePub downloads, according to the available data) and Abstracts Views on Vision4Press platform.
Data correspond to usage on the plateform after 2015. The current usage metrics is available 48-96 hours after online publication and is updated daily on week days.
Initial download of the metrics may take a while.