Fig. 4
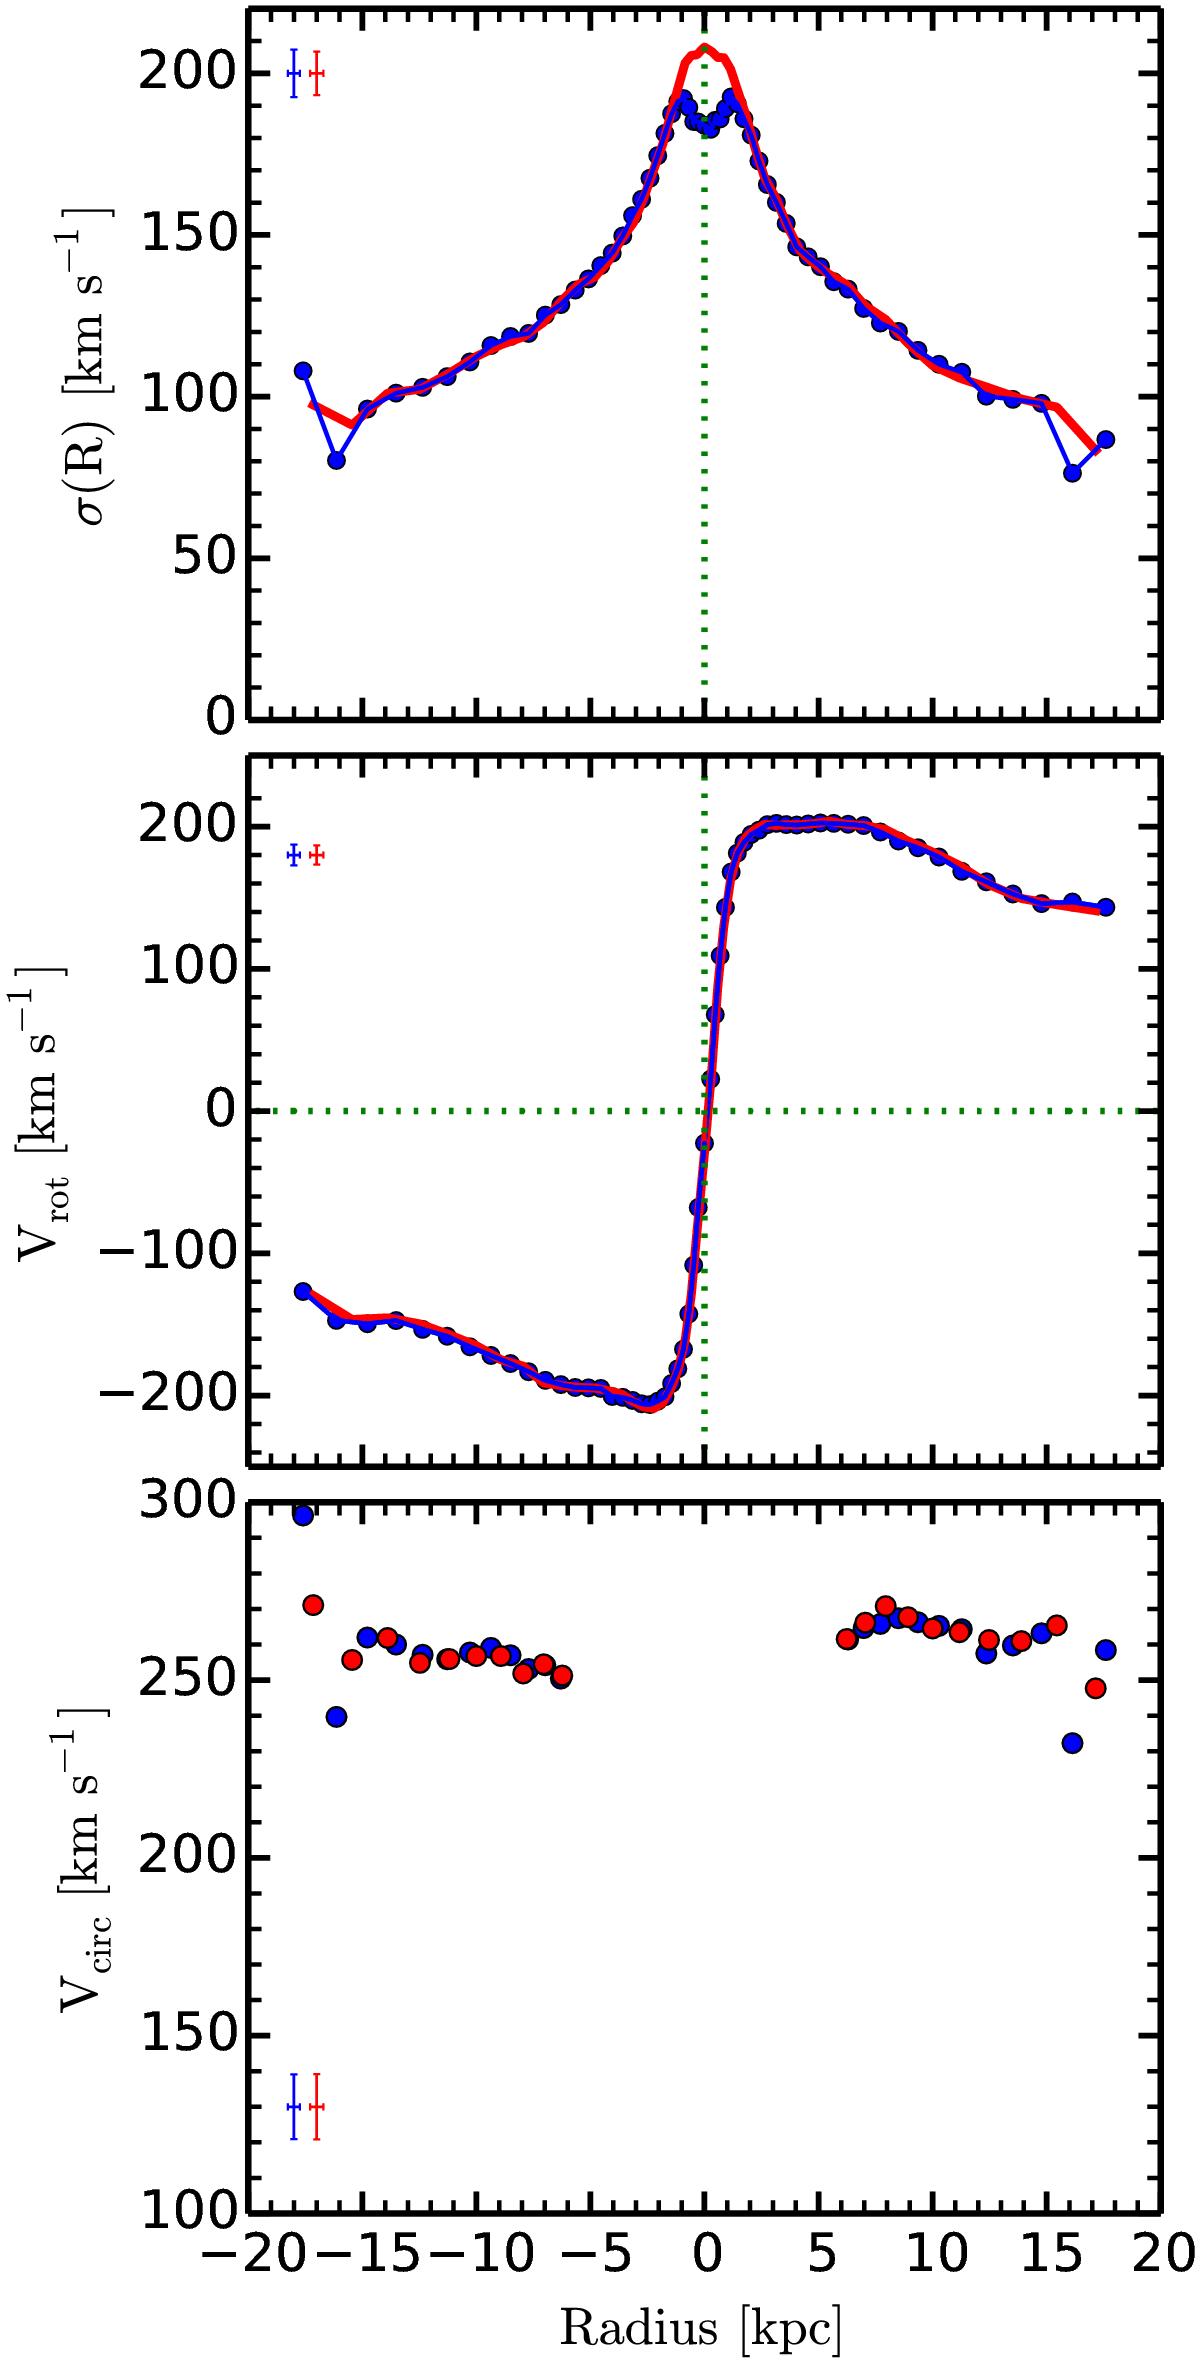
Top panel: velocity dispersion profile of the S0 remnant of the merger experiment gSagSao9. Middle panel: rotation curve for the remnant. Bottom panel: circular velocity measurements (after applying the asymmetric drift correction to its rotation curve) used to derive the circular velocity of this S0 remnant, as explained in Sect. 3.4.2. In the three panels, the red circles correspond to the values obtained by weighting the data by the stellar mass of the particles, whereas the blue correspond to the luminosity-weighted values. The error bars in each panel corresponds to the width of the radial bin and the statistical error on the y-axis.
Current usage metrics show cumulative count of Article Views (full-text article views including HTML views, PDF and ePub downloads, according to the available data) and Abstracts Views on Vision4Press platform.
Data correspond to usage on the plateform after 2015. The current usage metrics is available 48-96 hours after online publication and is updated daily on week days.
Initial download of the metrics may take a while.