Fig. B.4
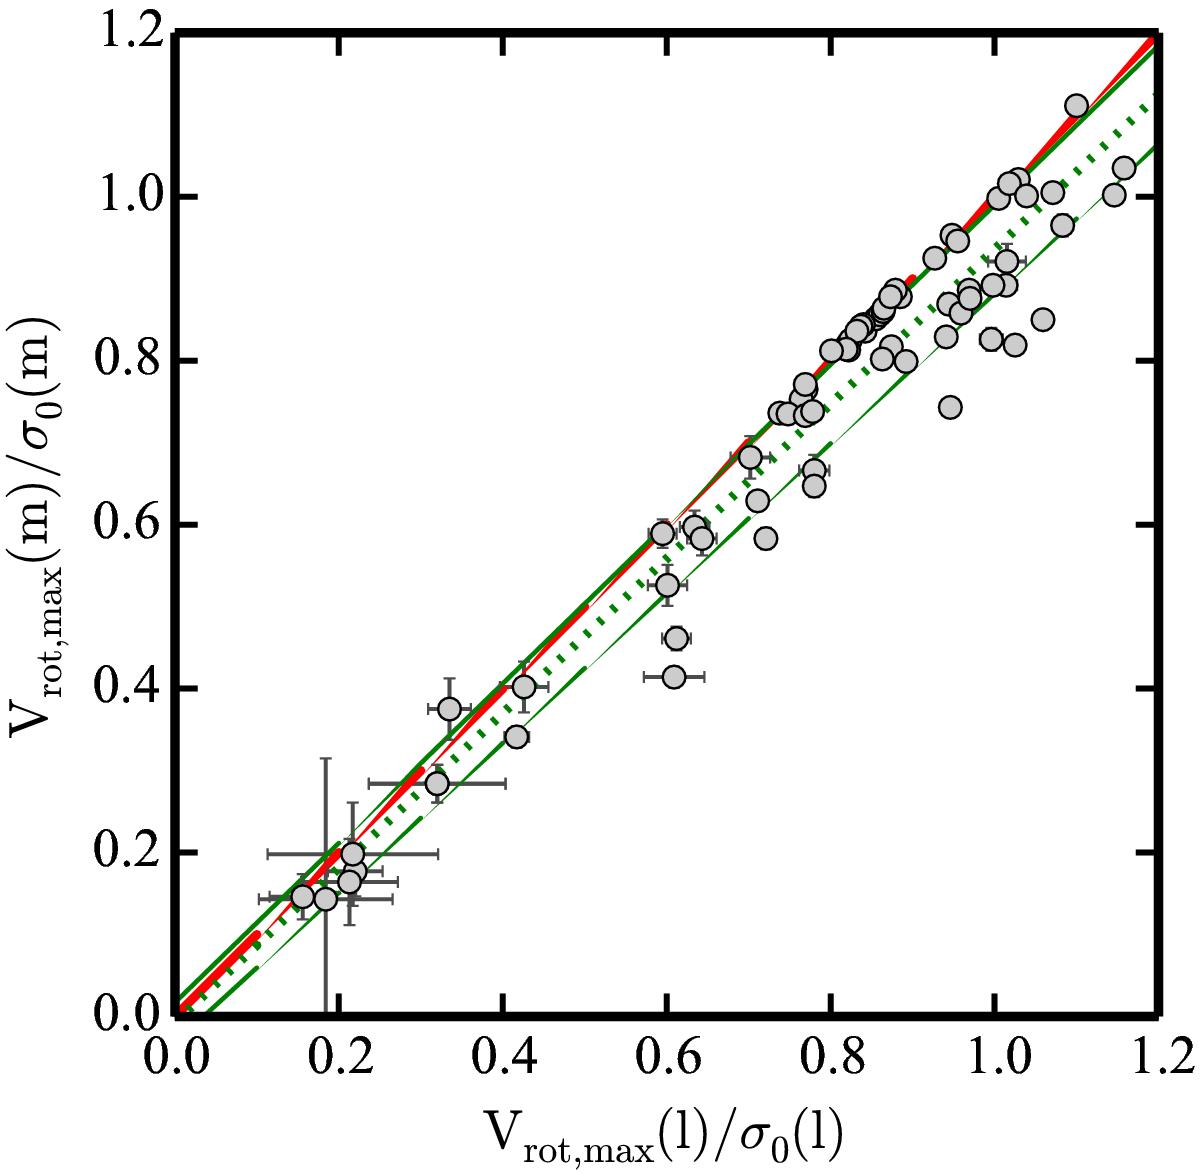
Mass-weighted Vrot,max/σ0 ratio of the S0-like remnants compared with the luminosity-weighted Vrot,max/σ0 ratio. The green dotted line corresponds to the linear fit performed to the data and the green solid lines represent the minimum and maximum slope according to the errors of the fit. The red line denotes the 1:1 relation.
Current usage metrics show cumulative count of Article Views (full-text article views including HTML views, PDF and ePub downloads, according to the available data) and Abstracts Views on Vision4Press platform.
Data correspond to usage on the plateform after 2015. The current usage metrics is available 48-96 hours after online publication and is updated daily on week days.
Initial download of the metrics may take a while.