Fig. B.2
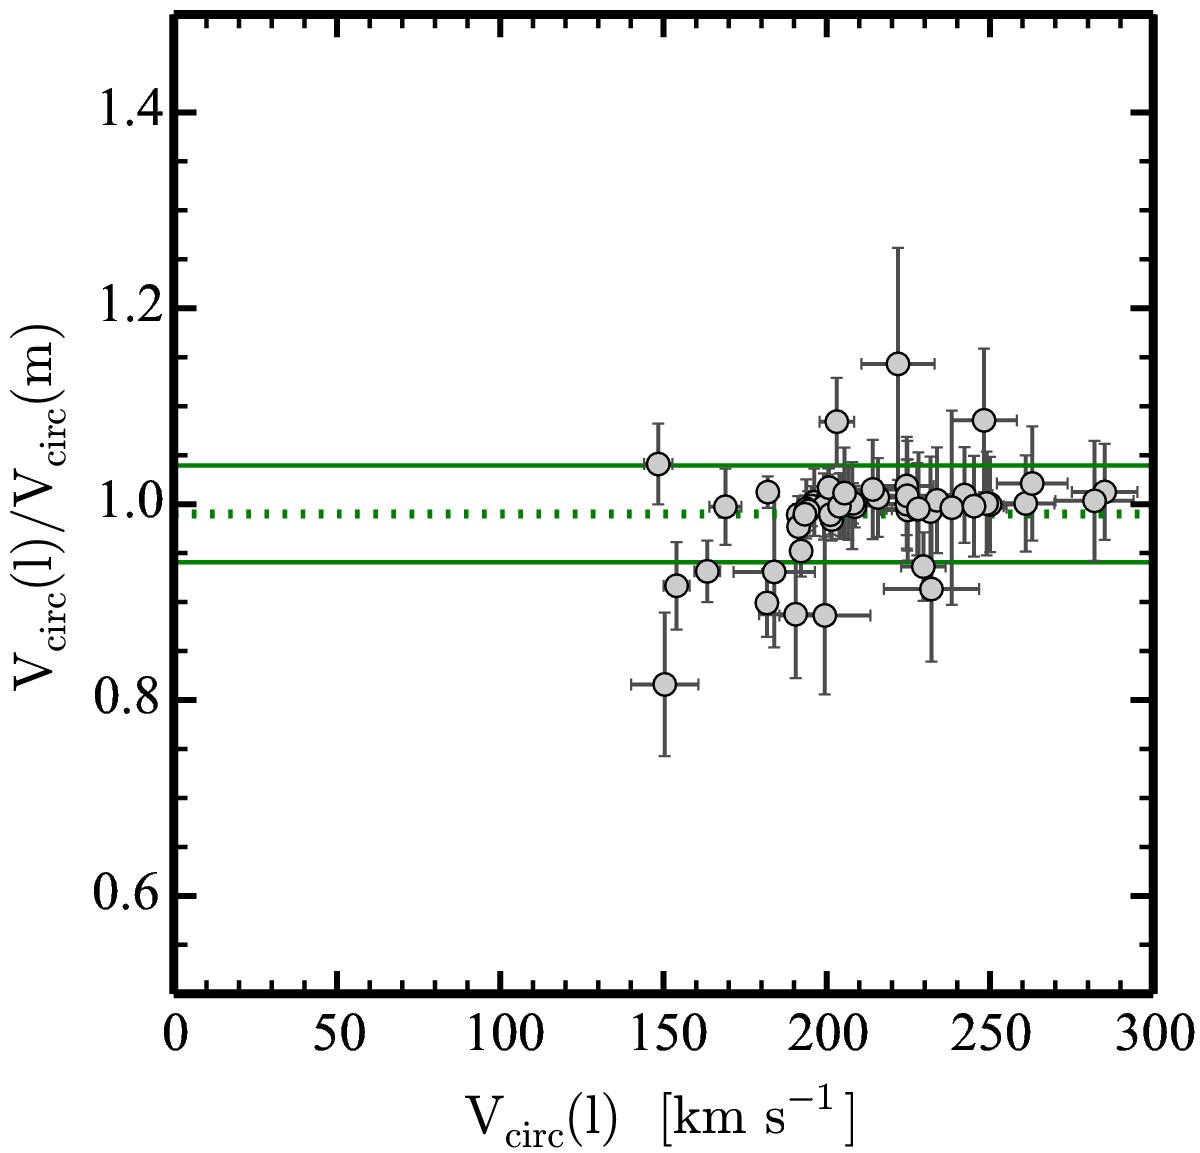
Ratio between the circular velocity measurements obtained when weighting by the luminosity (Vcirc(l)) and by the mass (Vcirc(m)) as a function of Vcirc(l) for our S0-like remnants (grey circles). The green dotted line corresponds to the sample mean, and the green solid lines represent the 1σ scatter. The error bars correspond to the individual errors in each axis.
Current usage metrics show cumulative count of Article Views (full-text article views including HTML views, PDF and ePub downloads, according to the available data) and Abstracts Views on Vision4Press platform.
Data correspond to usage on the plateform after 2015. The current usage metrics is available 48-96 hours after online publication and is updated daily on week days.
Initial download of the metrics may take a while.