Fig. A.1
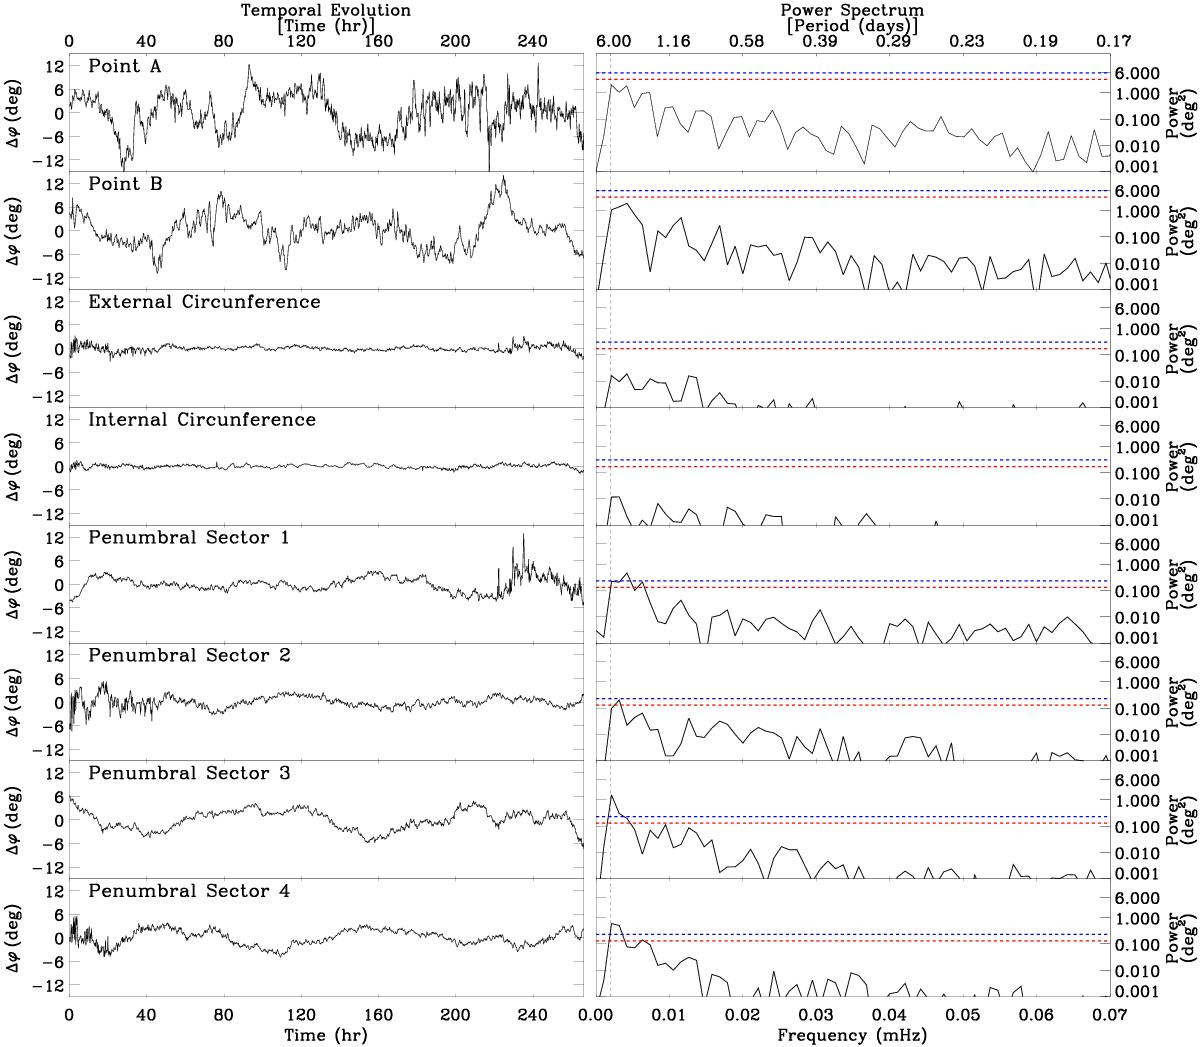
Left column: variation of the azimuth as a function of time (after the long-term trend was substracted) evaluated at: points A and B from Fig. 4, external and internal circumferences, and four penumbral sectors. Right column: power spectra on logarithmic scale of the time series in the left panels. The vertical dashed line corresponds to the frequency associated to a six day period (our upper period limit) and the horizontal dashed lines are the confidence level for each case. The red one represents the 3σ level when the sunspot is close to the East limb and the blue one when it is crossing the central meridian.
Current usage metrics show cumulative count of Article Views (full-text article views including HTML views, PDF and ePub downloads, according to the available data) and Abstracts Views on Vision4Press platform.
Data correspond to usage on the plateform after 2015. The current usage metrics is available 48-96 hours after online publication and is updated daily on week days.
Initial download of the metrics may take a while.