Free Access
Fig. 5
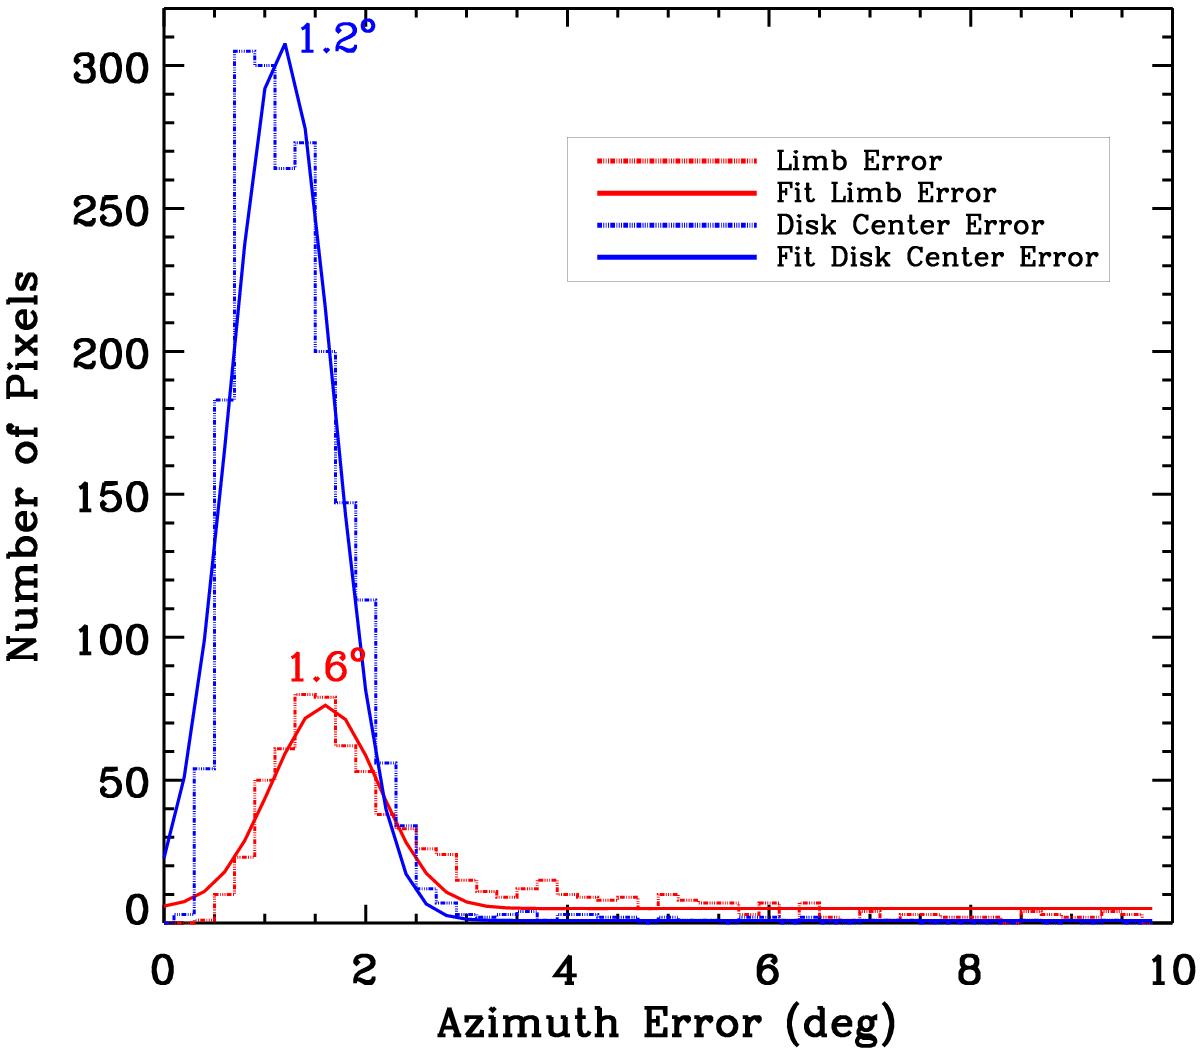
Dotted lines represent the azimuth error distribution of the sunspot penumbra for 2 different time steps: when the sunspot is at the East limb (red) and when the sunspot is crossing the central meridian (blue). Solid lines are the Gaussian fits to each distribution.
Current usage metrics show cumulative count of Article Views (full-text article views including HTML views, PDF and ePub downloads, according to the available data) and Abstracts Views on Vision4Press platform.
Data correspond to usage on the plateform after 2015. The current usage metrics is available 48-96 hours after online publication and is updated daily on week days.
Initial download of the metrics may take a while.