Fig. 2
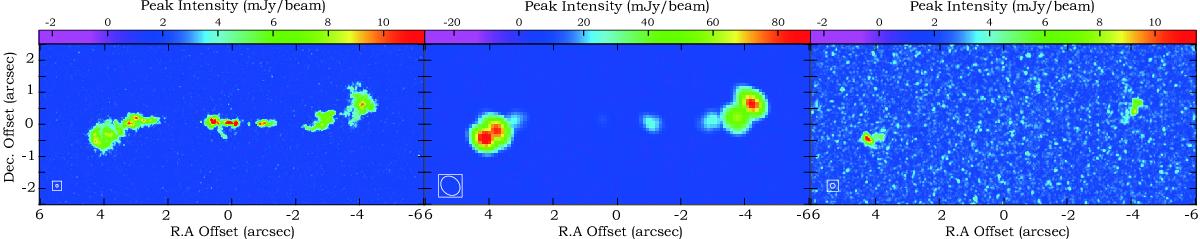
SiO(5–4) (left, 0.̋08 beam in the lower left corner), H2CO(303–202) (middle, 0.̋6 beam), and CH3OH(8-1–70) (right, 0.̋15 beam) images towards HD 101584 produced by selecting the peak intensity (in absolute terms along the velocity axis) in each pixel. This highlights the morphology of the high-velocity outflow. In particular, the methanol line emission marks the positions of the 4′′ W and 4′′ E EVSs.
Current usage metrics show cumulative count of Article Views (full-text article views including HTML views, PDF and ePub downloads, according to the available data) and Abstracts Views on Vision4Press platform.
Data correspond to usage on the plateform after 2015. The current usage metrics is available 48-96 hours after online publication and is updated daily on week days.
Initial download of the metrics may take a while.