Fig. 6
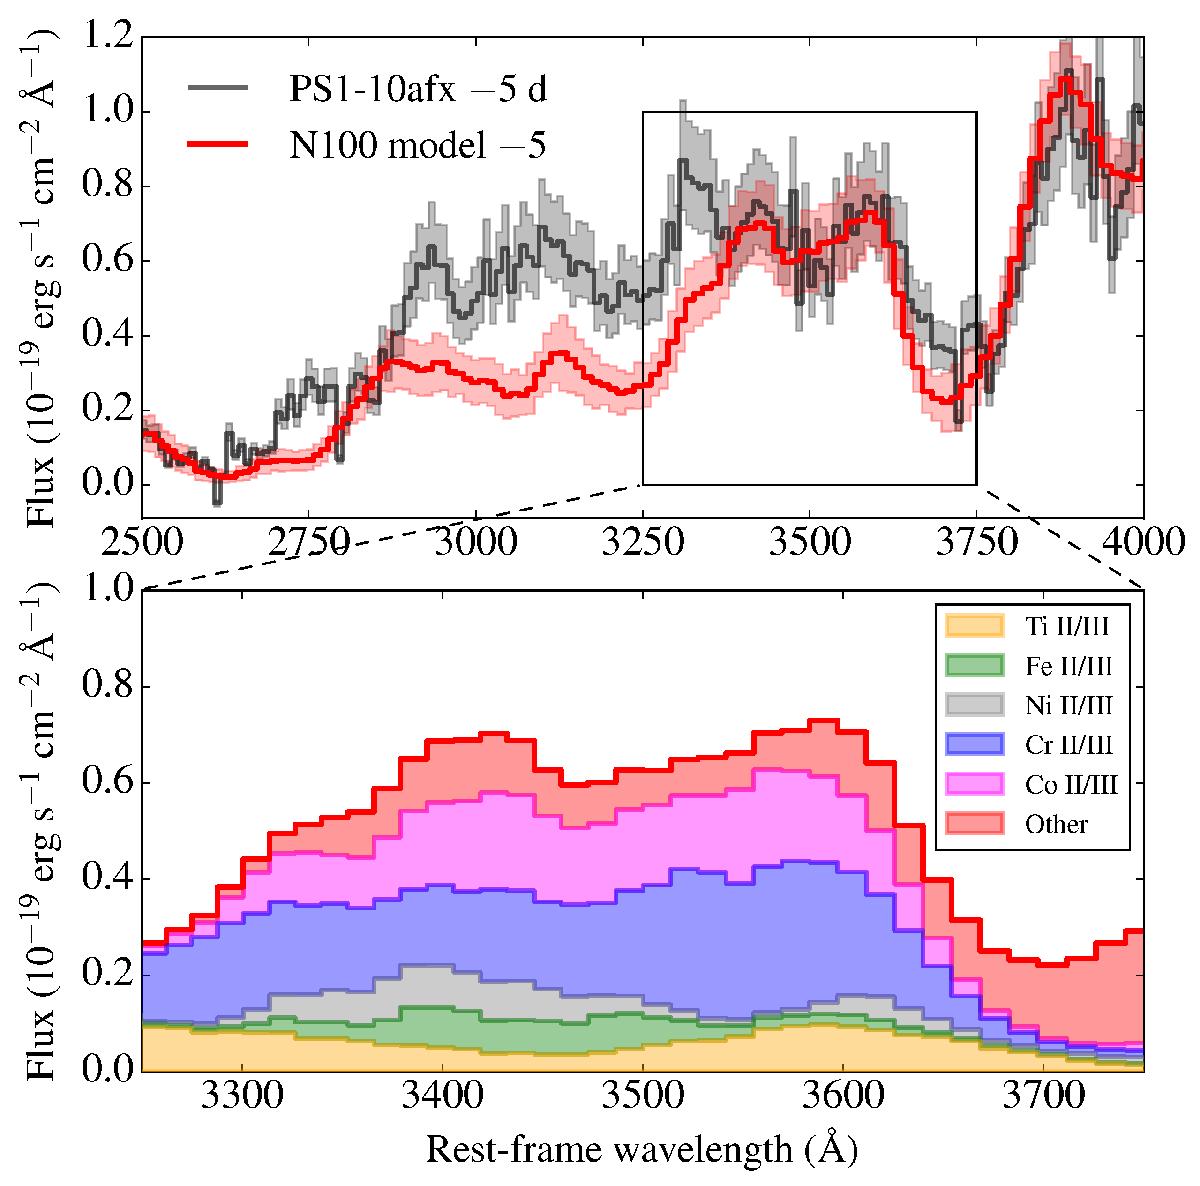
Upper panel: same as Fig. 5, but in the near-UV. The observed spectrum was rebinned by a factor of 15 to have a similar bin size (~10 Å) as in the model spectrum. Bottom panel: zoom of the N100 model into the spectral region around 3500 Å. The region below the total flux (red line) is colour-coded to indicate the relative contributions of different element transitions.
Current usage metrics show cumulative count of Article Views (full-text article views including HTML views, PDF and ePub downloads, according to the available data) and Abstracts Views on Vision4Press platform.
Data correspond to usage on the plateform after 2015. The current usage metrics is available 48-96 hours after online publication and is updated daily on week days.
Initial download of the metrics may take a while.