Free Access
Fig. 4
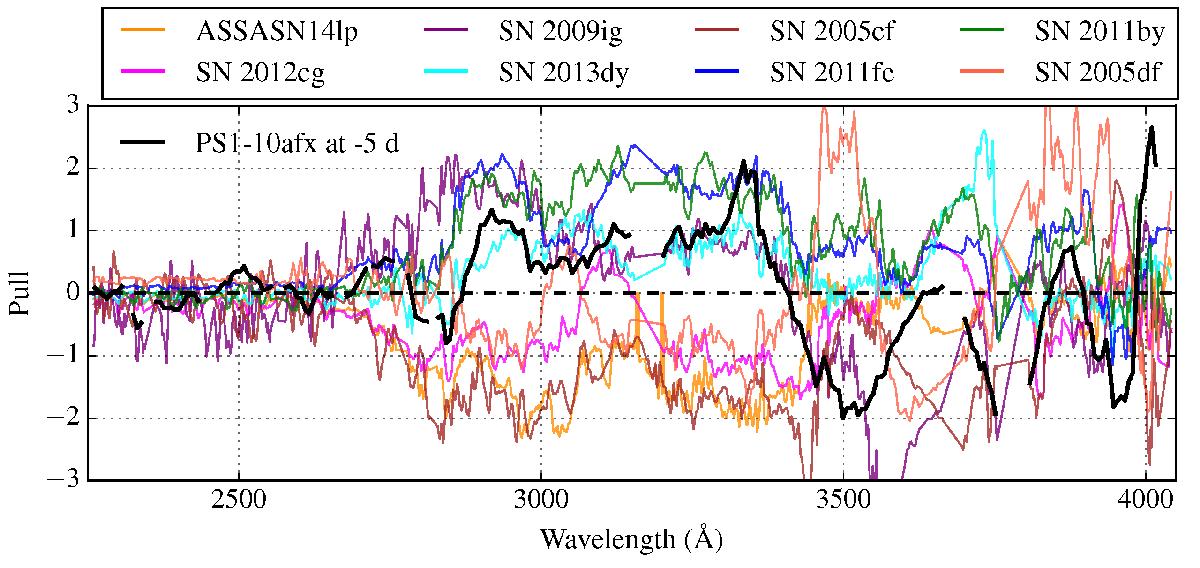
Pull of PS1-10afx at − 5.0d compared with the low-redshift median spectrum constructed from all the SNe Ia in Table 2, shown by the black line. The coloured lines represent the pulls of the individual nearby SNe Ia compared to the median spectrum constructed by leaving that one out from all the SNe Ia spectra.
Current usage metrics show cumulative count of Article Views (full-text article views including HTML views, PDF and ePub downloads, according to the available data) and Abstracts Views on Vision4Press platform.
Data correspond to usage on the plateform after 2015. The current usage metrics is available 48-96 hours after online publication and is updated daily on week days.
Initial download of the metrics may take a while.