Fig. 3
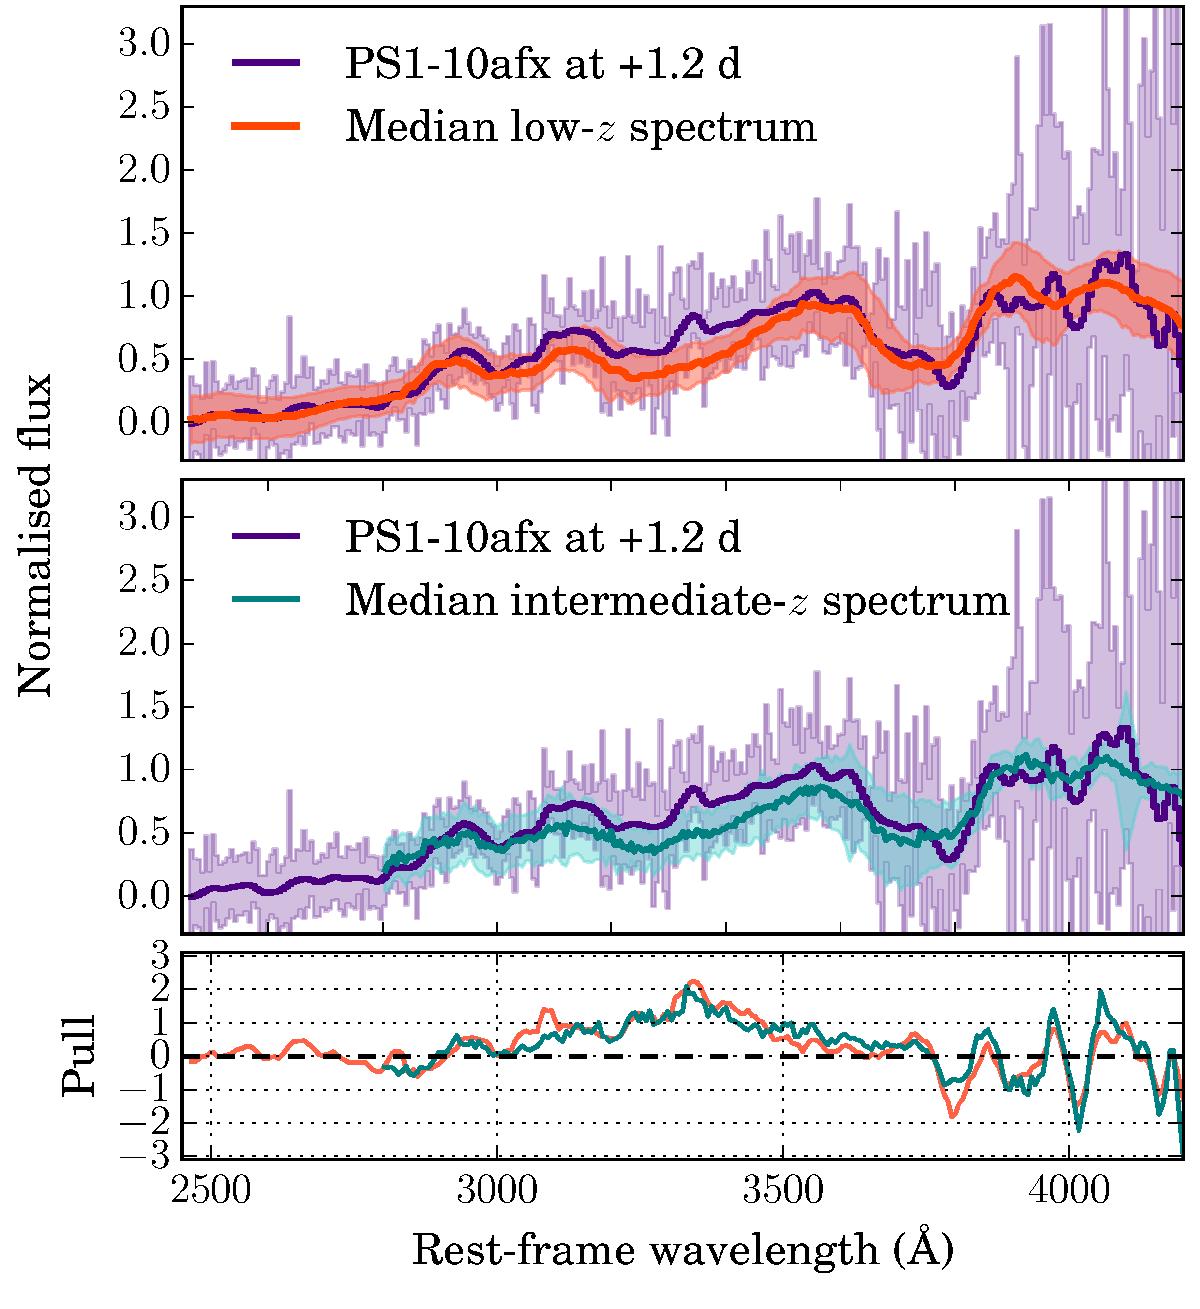
PS1-10afx at + 1.2 d compared with low- and intermediate-redshift median spectra constructed from normal SNe Ia at similar phases. The shaded regions represent the root mean square of the sample in pink and cyan for the nearby and intermediate SNe Ia, respectively. The lower panel shows the pull for the low- (pink) and intermediate-redshift (cyan) spectrum.
Current usage metrics show cumulative count of Article Views (full-text article views including HTML views, PDF and ePub downloads, according to the available data) and Abstracts Views on Vision4Press platform.
Data correspond to usage on the plateform after 2015. The current usage metrics is available 48-96 hours after online publication and is updated daily on week days.
Initial download of the metrics may take a while.