Fig. 1
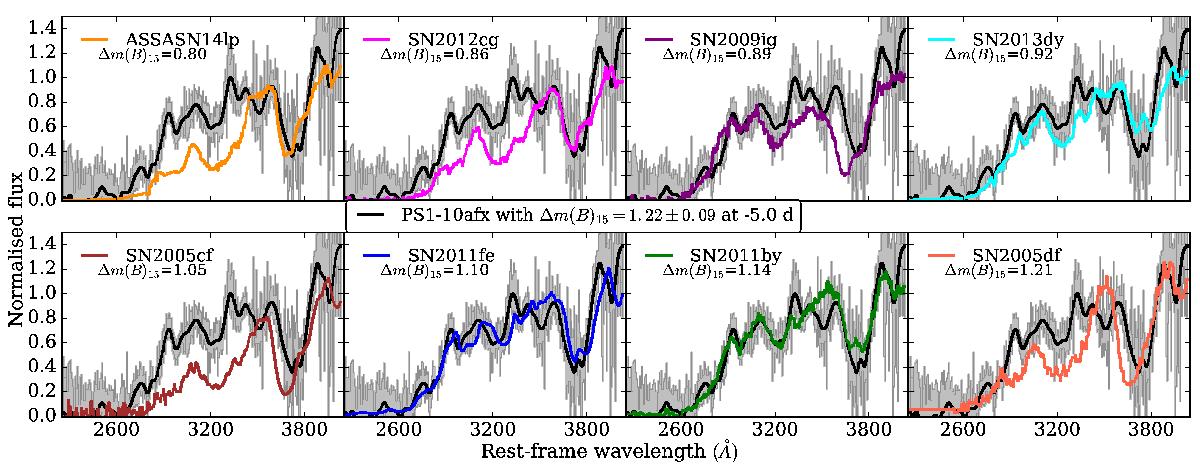
PS1-10afx at phase − 5.0 d (grey line) and nearby SN Ia spectra at similar phases. When there were two spectra close to the required phase, we took the average. The black line shows the PS1-10afx spectrum rebinned by a factor of 10. The spectra were normalised at ~4000 Å. The nearby spectra are ordered according to their light-curve shape parameter Δm15(B).
Current usage metrics show cumulative count of Article Views (full-text article views including HTML views, PDF and ePub downloads, according to the available data) and Abstracts Views on Vision4Press platform.
Data correspond to usage on the plateform after 2015. The current usage metrics is available 48-96 hours after online publication and is updated daily on week days.
Initial download of the metrics may take a while.