Fig. 3
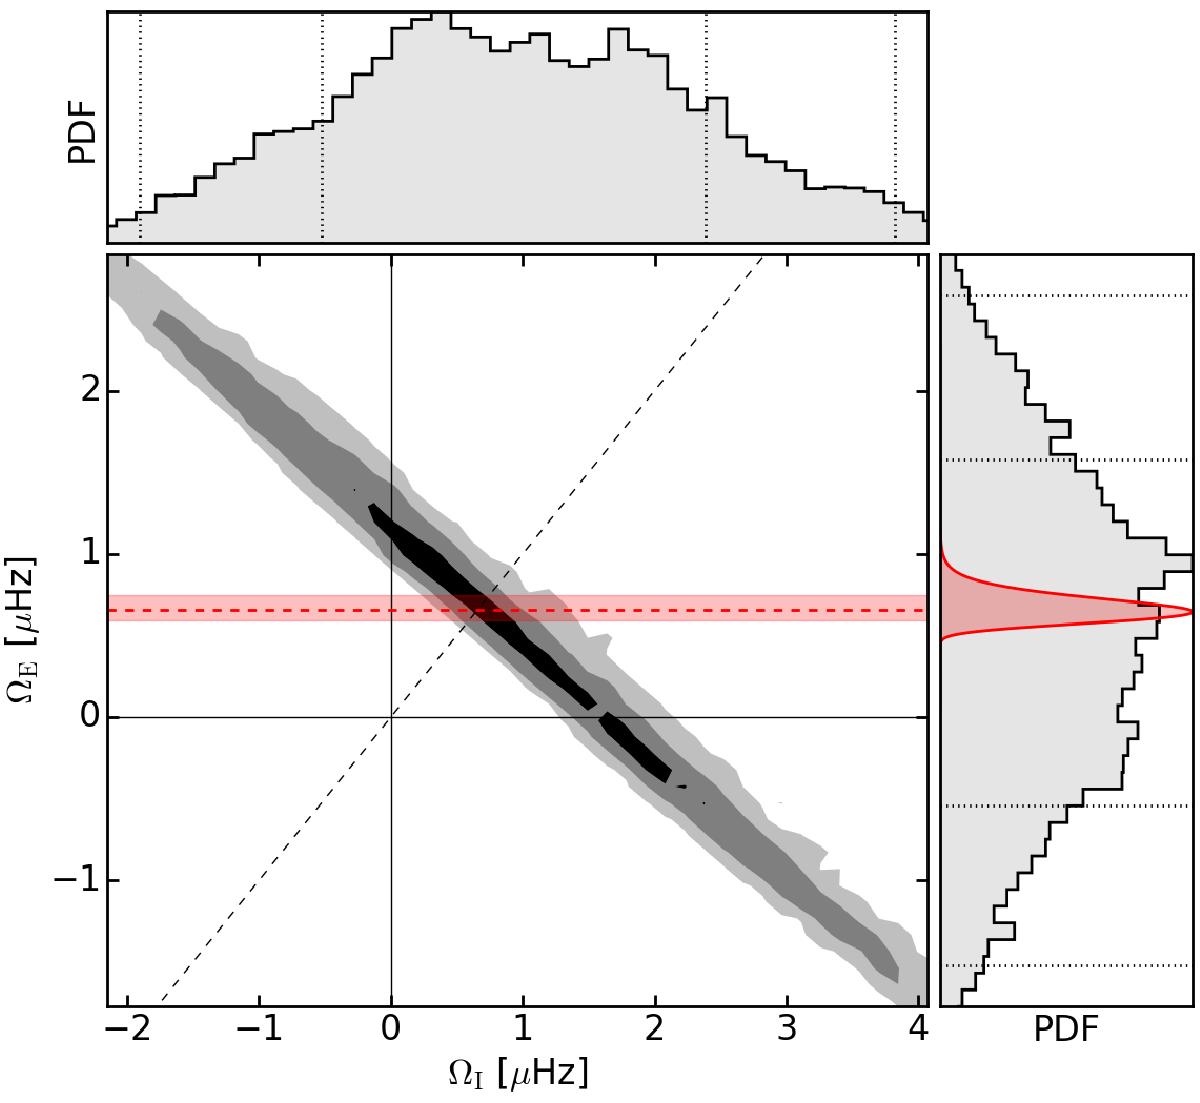
Correlation between the posterior density of ΩE (right) and ΩI (top) for KIC 006116048 before the application of a prior (in grayscale). From the posteriors themselves it is clear that the two parameters are poorly constrained, with a standard deviation of several μHz in both cases. The two parameters are, however, strongly anti-correlated. In the center frame the dashed black line indicates ΩE = ΩI. Dashed red denotes the median of the ΩS probability density function, and the shaded bar corresponds to the 68% confidence interval. The full distribution of ΩS is shown in the right panel, which is used as a prior to constrain ΩE.
Current usage metrics show cumulative count of Article Views (full-text article views including HTML views, PDF and ePub downloads, according to the available data) and Abstracts Views on Vision4Press platform.
Data correspond to usage on the plateform after 2015. The current usage metrics is available 48-96 hours after online publication and is updated daily on week days.
Initial download of the metrics may take a while.