Fig. 1
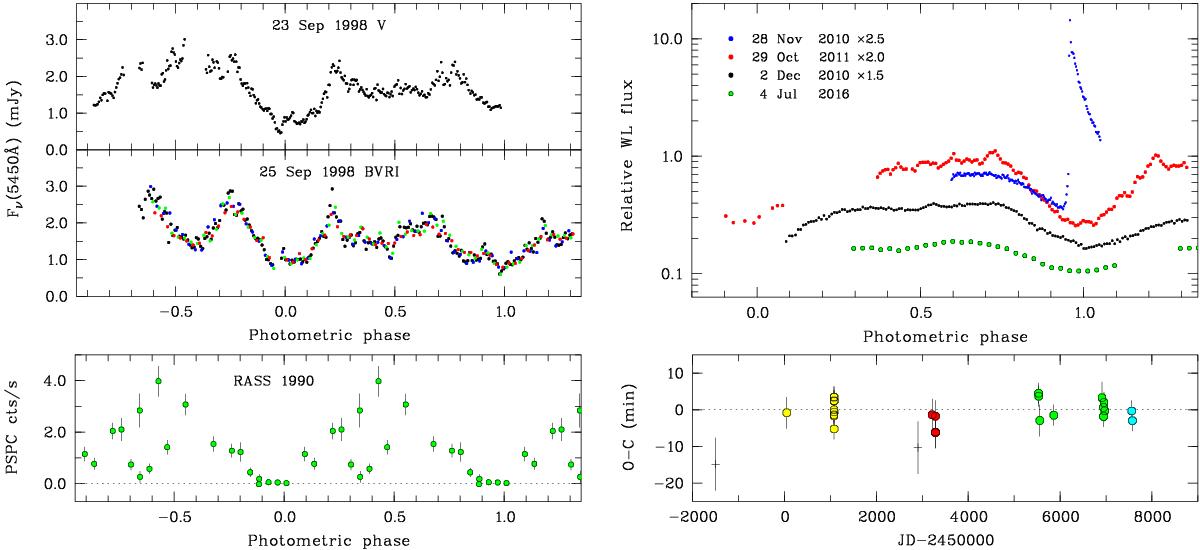
Bottom left: soft X-ray light curve of V358 Aqr observed during the RASS in December 1990. Top left: high-state V-band light curve of 23 September 1998 and BVRI light curves of 25 September 1998 reduced to V, using the mean colors. Top right: intermediate-state light curves measured in WL in 2010, 2011, and 2016, shifted vertically to avoid overlap. Bottom right: O–C diagram, displaying the deviations of the times of the primary photometric minimum from the linear ephemeris of Eq. (1). The two data points indicated by crosses have been excluded from the linear fit that yields the ephemeris.
Current usage metrics show cumulative count of Article Views (full-text article views including HTML views, PDF and ePub downloads, according to the available data) and Abstracts Views on Vision4Press platform.
Data correspond to usage on the plateform after 2015. The current usage metrics is available 48-96 hours after online publication and is updated daily on week days.
Initial download of the metrics may take a while.