Fig. 4
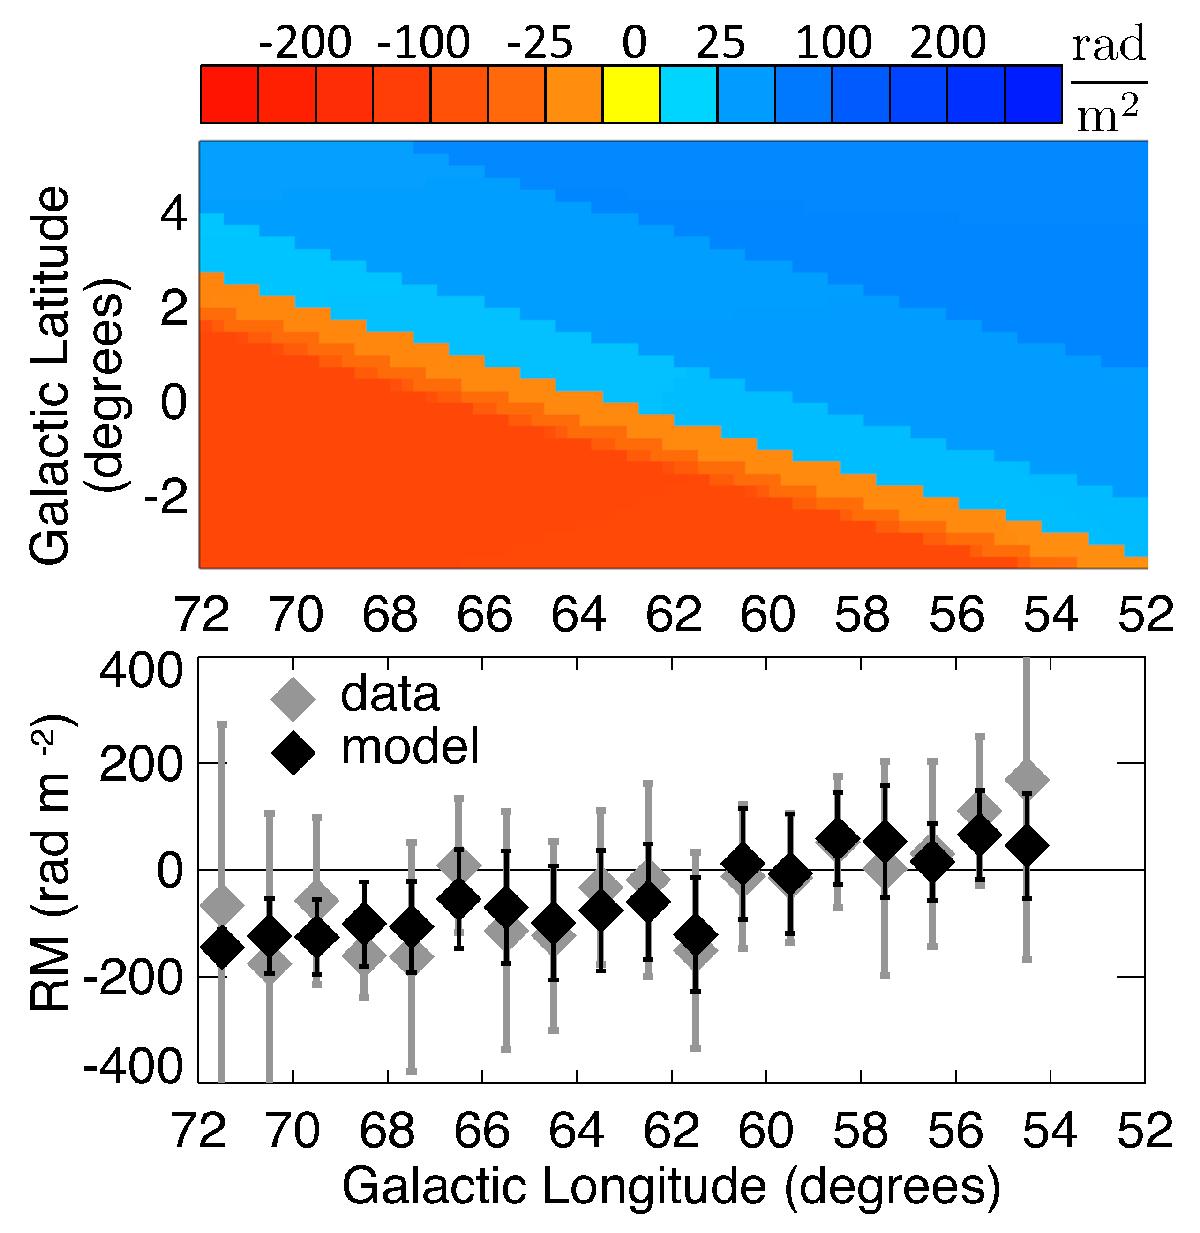
Results of the Parker spiral-like model for the CGPS low longitude range. Top panel: RM map for the XE in the region, showing the diagonal boundary. Bottom panel: data (grey) and model (black) RMs averaged into 1° longitude bins as a function of Galactic longitude. The error bars in the bottom panel were determined as the standard deviations within the bins.
Current usage metrics show cumulative count of Article Views (full-text article views including HTML views, PDF and ePub downloads, according to the available data) and Abstracts Views on Vision4Press platform.
Data correspond to usage on the plateform after 2015. The current usage metrics is available 48-96 hours after online publication and is updated daily on week days.
Initial download of the metrics may take a while.