Fig. 3
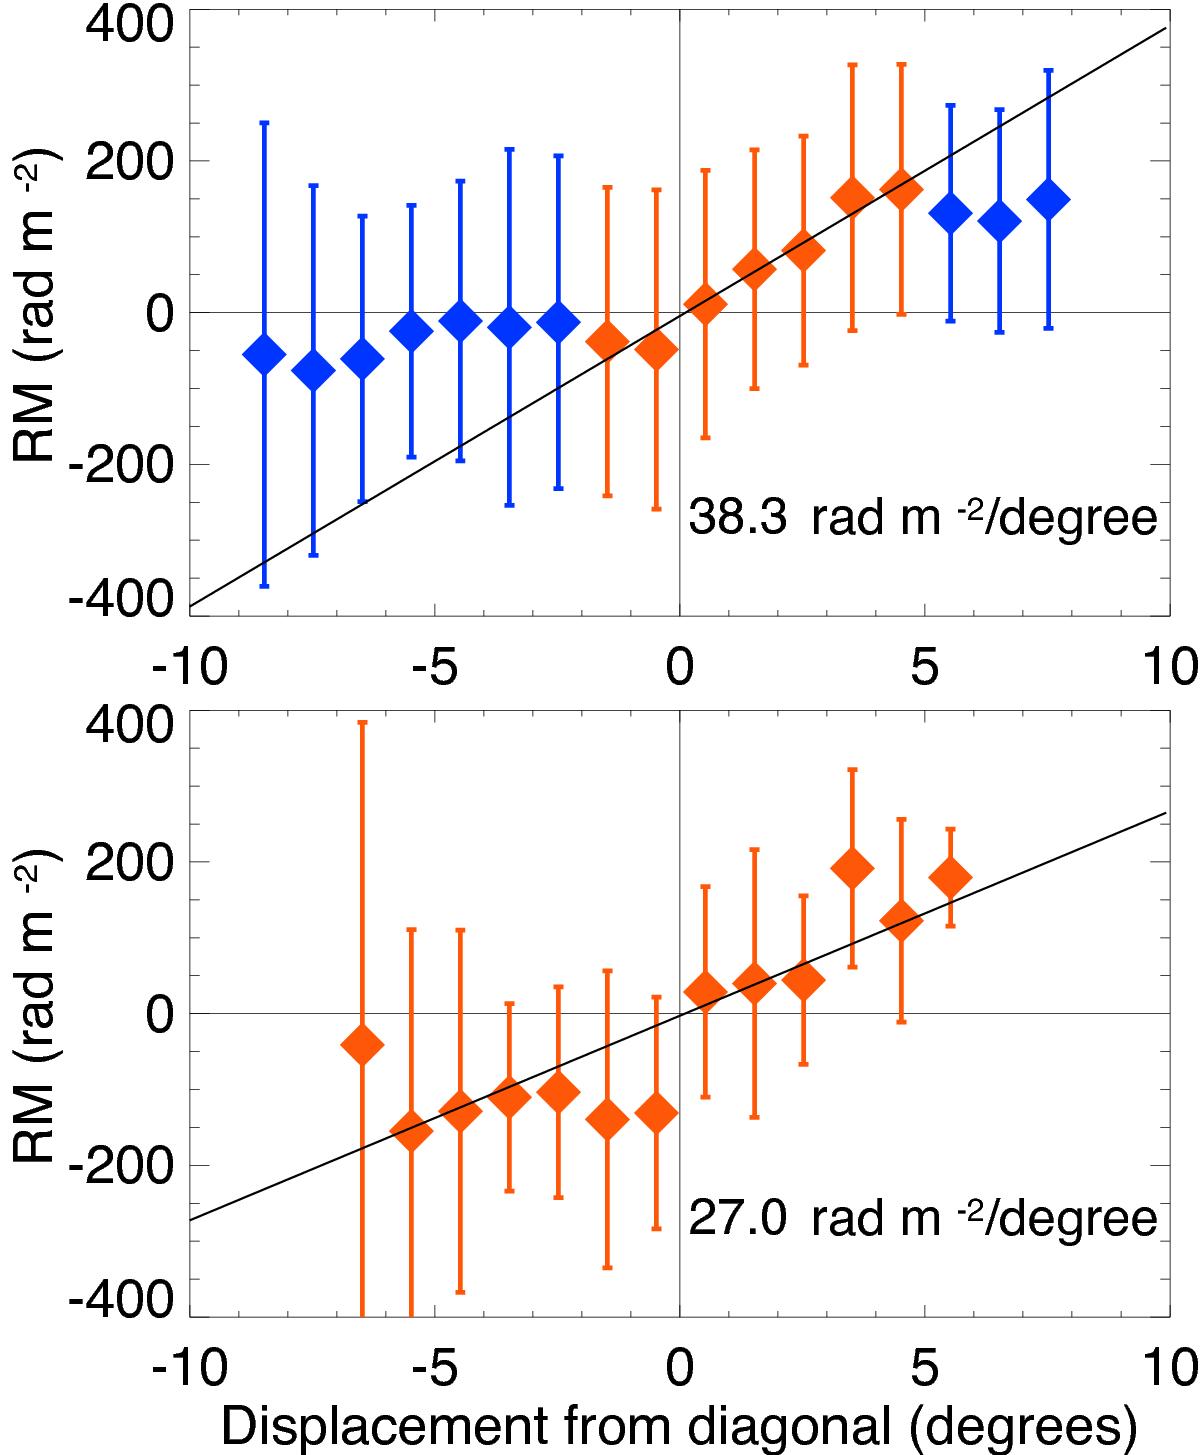
RM versus displacement from the diagonal boundary in the RM map for XE data (top panel) and EG data (bottom panel). Positive (negative) displacement corresponds to regions above (below) the boundary. Blue symbols indicate where the RM versus displacement is relatively flat. The slopes quantifying the gradient are calculated using the orange symbols. Note that for the EG data, the slope is more gradual and no clear flat regions are identifiable. The error bars were determined as the standard deviations within the bins.
Current usage metrics show cumulative count of Article Views (full-text article views including HTML views, PDF and ePub downloads, according to the available data) and Abstracts Views on Vision4Press platform.
Data correspond to usage on the plateform after 2015. The current usage metrics is available 48-96 hours after online publication and is updated daily on week days.
Initial download of the metrics may take a while.