Fig. 2
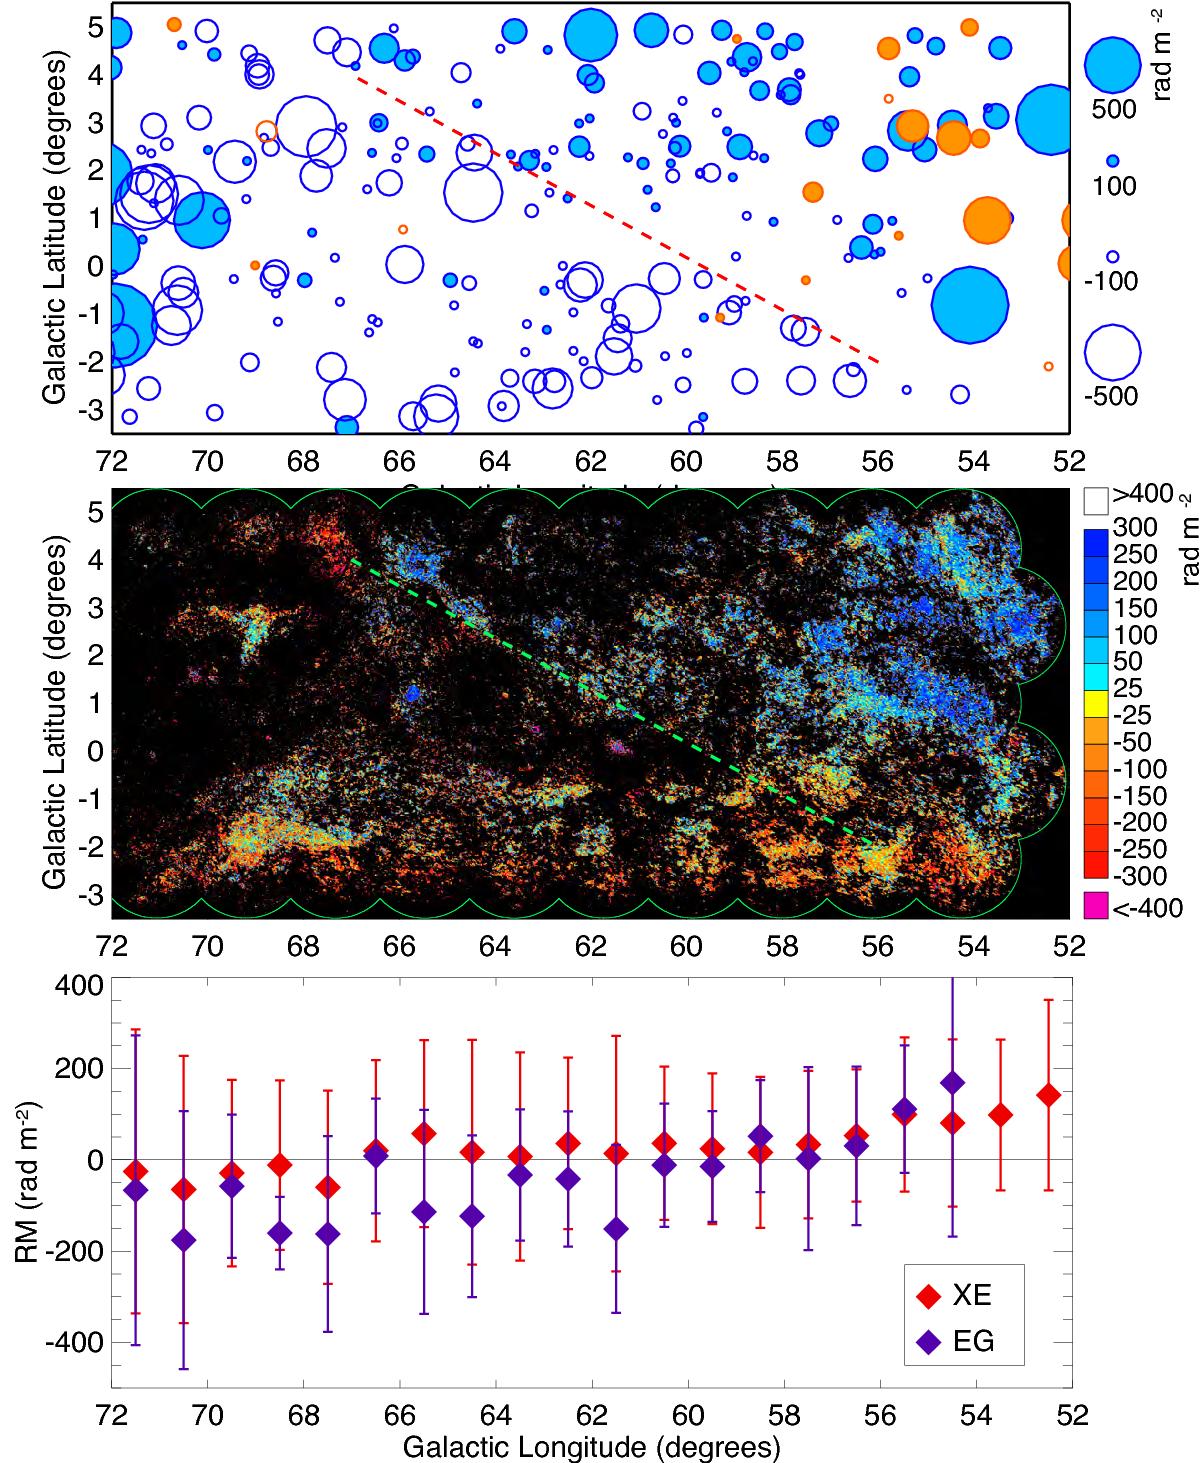
Low longitude CGPS Rotation Measures. Top panel: RMs of extragalactic sources (blue) and pulsars (orange). Second panel: RMs of extended emission using only interferometer data. The diagonal lines indicate the approximate location of the boundary across which the RM gradient occurs. Third panel: RMs of extended emission sources (red) and extragalactic sources (purple) as a function of Galactic longitude, averaged into 1° longitude bins. The error bars were determined as the standard deviations within the bins.
Current usage metrics show cumulative count of Article Views (full-text article views including HTML views, PDF and ePub downloads, according to the available data) and Abstracts Views on Vision4Press platform.
Data correspond to usage on the plateform after 2015. The current usage metrics is available 48-96 hours after online publication and is updated daily on week days.
Initial download of the metrics may take a while.