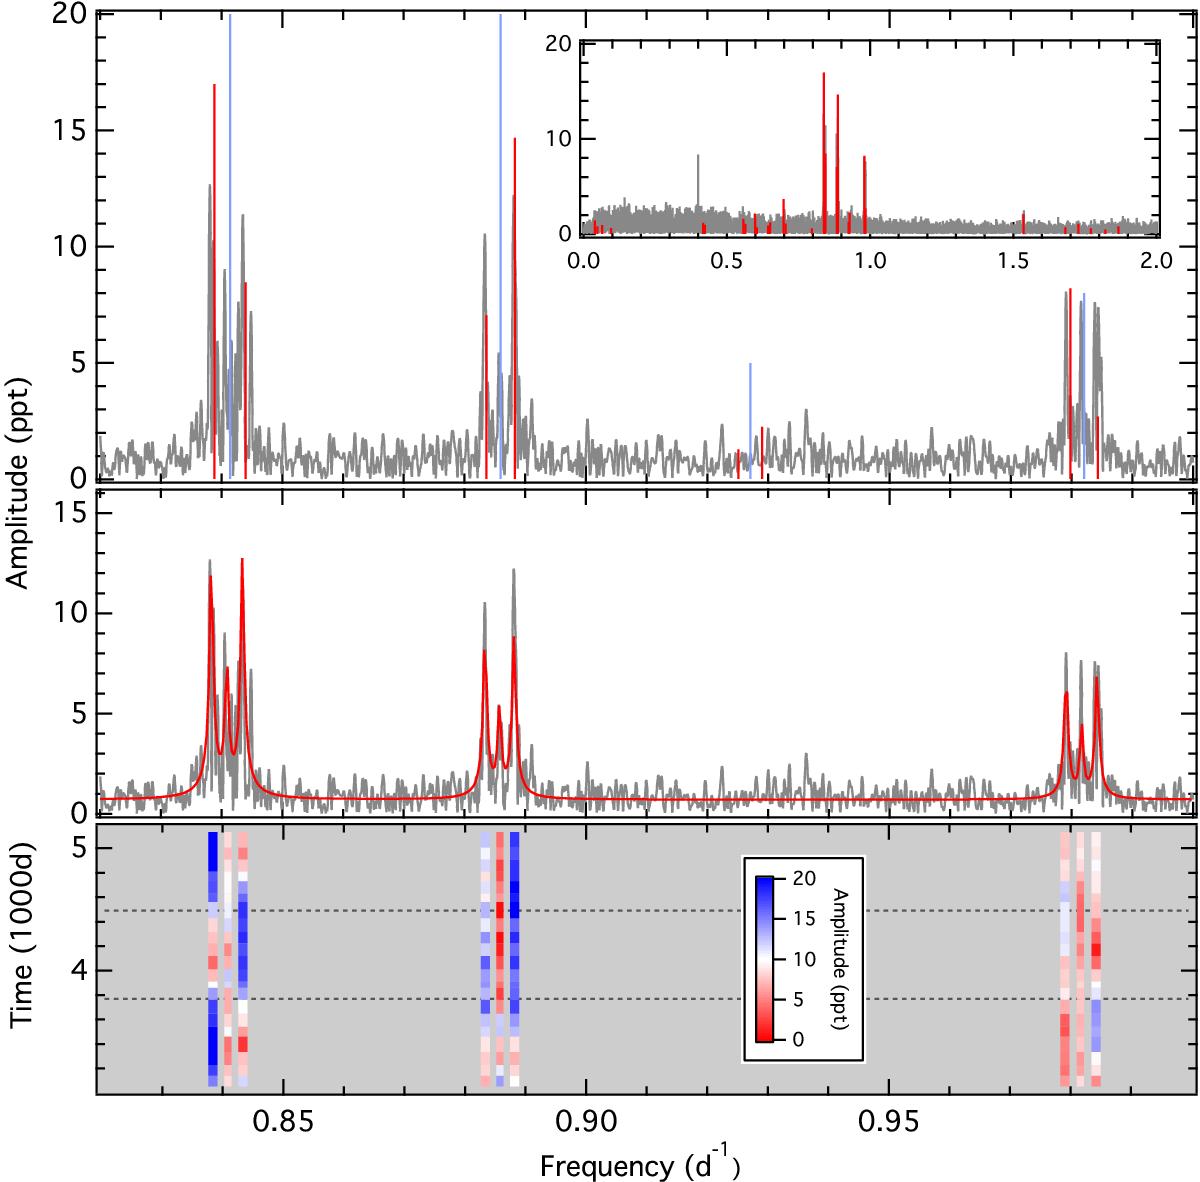
Fig. 8
Fourier amplitude spectrum of the SMEI data set of HD 201433. The top panel gives the original spectrum (grey line) with the red and blue lines indicating the significant frequenices in the BTr data set (Table 2) and their mid-point, respectively. The inset shows the full frequency range. The middle panel shows the same spectrum along with a sequence of Lorentzian profiles (red line) fitted to the spectrum. The bottom panel shows the (color-coded) amplitude at the central frequencies of the Lorentzians as a function of time. The amplitudes are determined within a 720 d long subset moved across the full time series in 100 d steps. The horizontal dotted lines separate fully independent parts.
Current usage metrics show cumulative count of Article Views (full-text article views including HTML views, PDF and ePub downloads, according to the available data) and Abstracts Views on Vision4Press platform.
Data correspond to usage on the plateform after 2015. The current usage metrics is available 48-96 hours after online publication and is updated daily on week days.
Initial download of the metrics may take a while.