Fig. 15
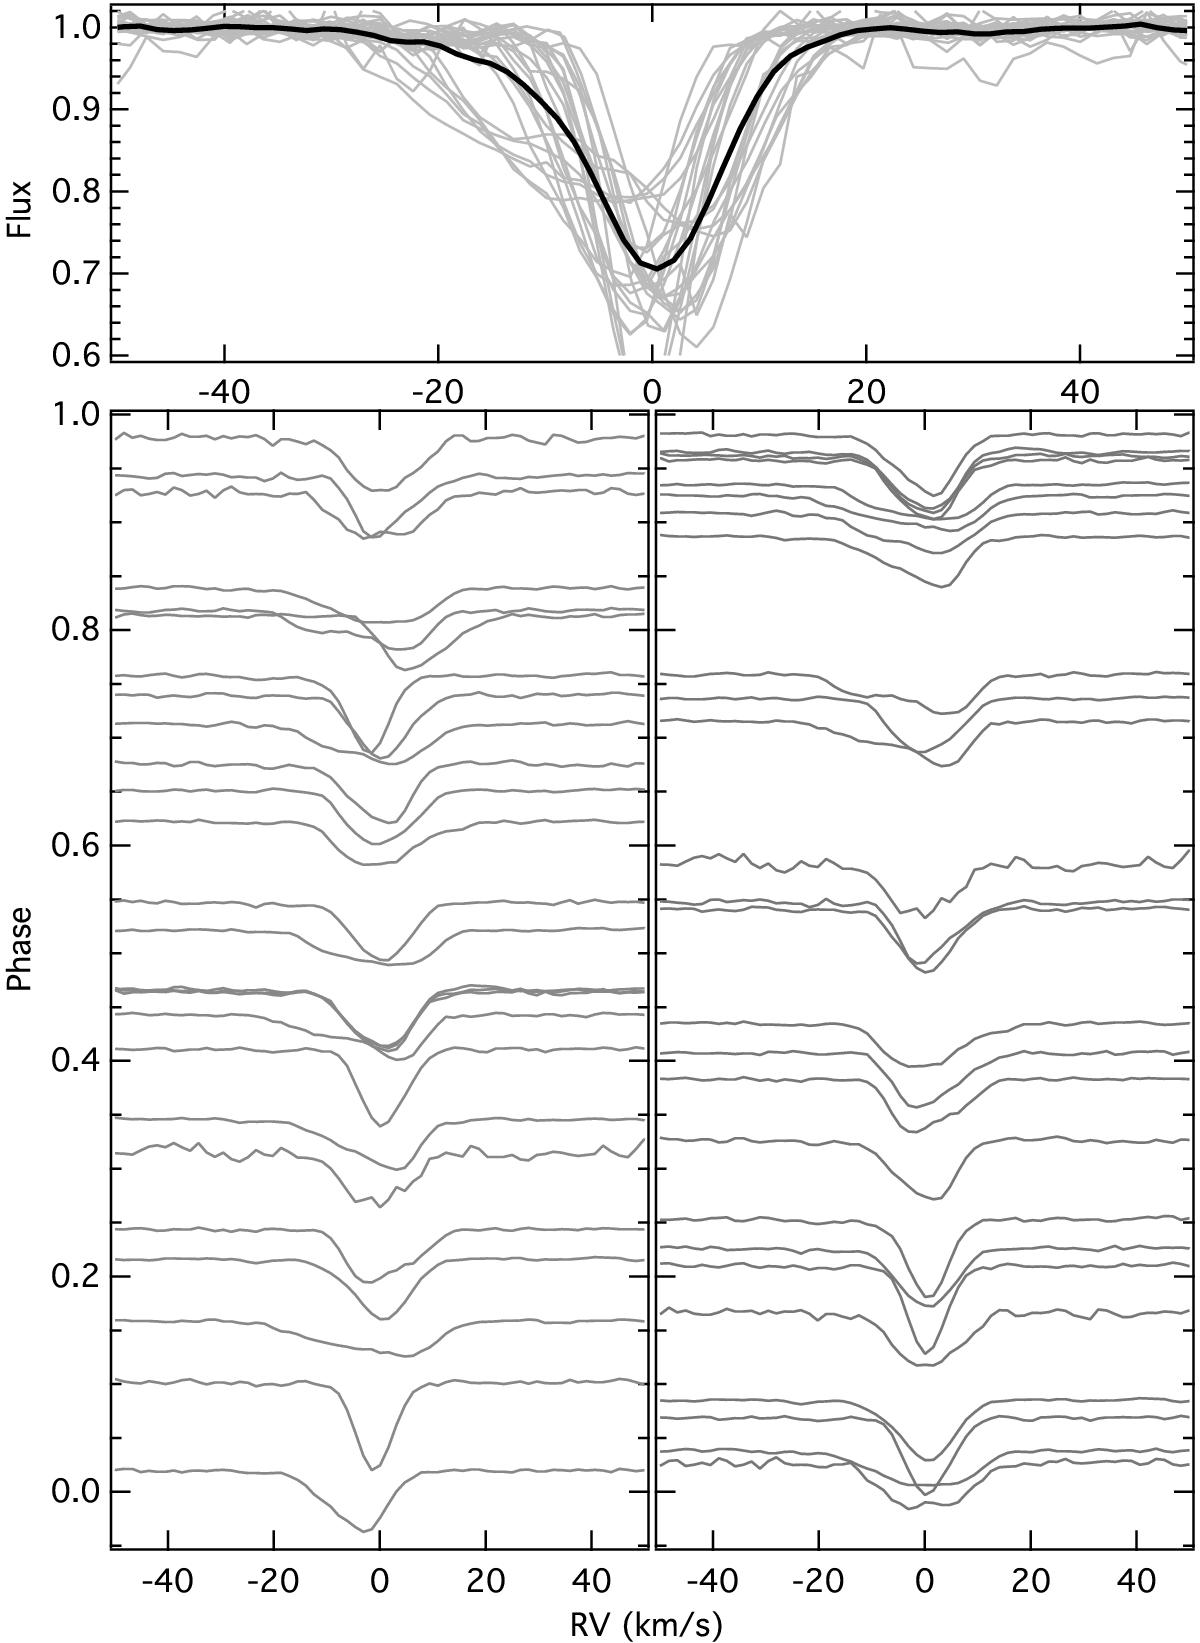
Line profile of the Fe ii (4233.1Å) line. The top panel shows the individual (grey lines) and average (black line) line profiles corrected for the orbital motion. The bottom panels show the individual profiles arbitrarily scaled and vertically shifted according to their orbital (left) and pulsation (right) phase (f1 from Table 2).
Current usage metrics show cumulative count of Article Views (full-text article views including HTML views, PDF and ePub downloads, according to the available data) and Abstracts Views on Vision4Press platform.
Data correspond to usage on the plateform after 2015. The current usage metrics is available 48-96 hours after online publication and is updated daily on week days.
Initial download of the metrics may take a while.