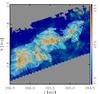
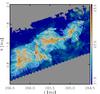
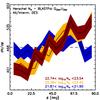
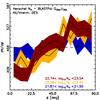
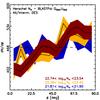
Fig. 3
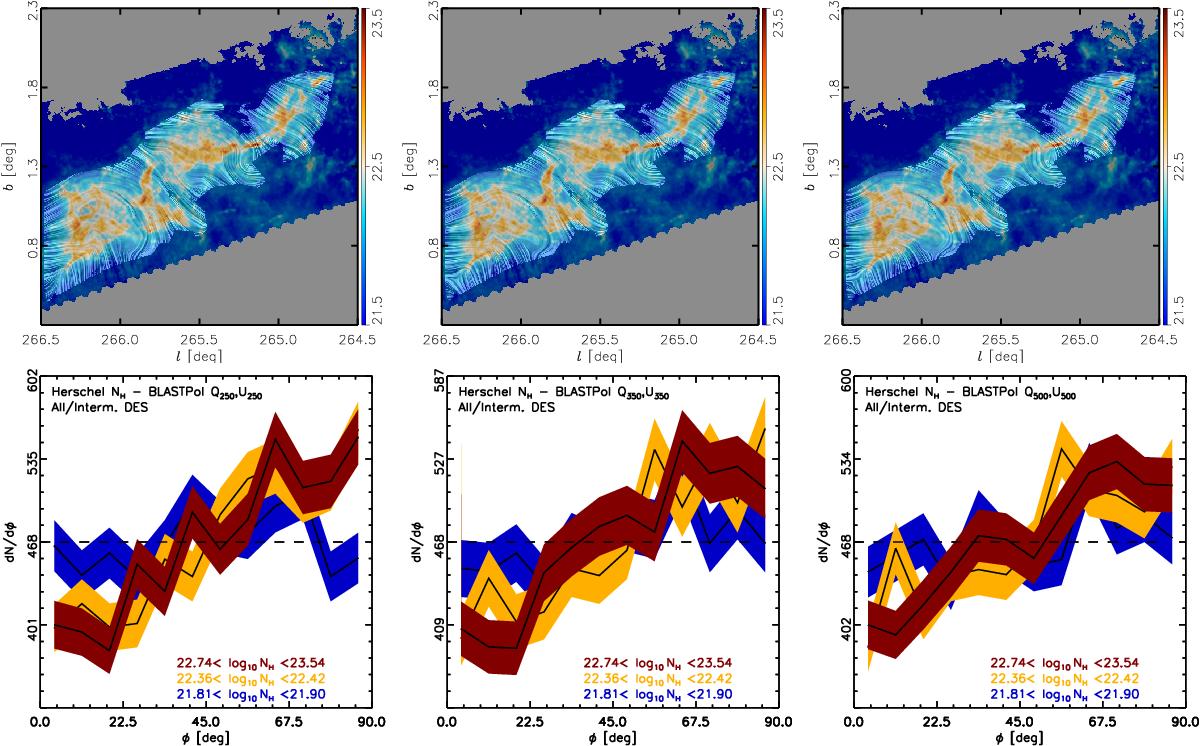
Top: magnetic field and total intensity measured by BLASTPol towards two regions in the Vela molecular ridge. The colours represent NH, the total gas column density inferred from the Herschel observations. The “drapery” pattern, produced using the line integral convolution method (LIC, Cabral & Leedom 1993), indicates the orientation of magnetic field lines, orthogonal to the orientation of the submillimetre polarization observed by BLASTPol at 250 (left), 350 (centre), and 500 μm (right). Bottom: histogram of the relative orientations (HRO) between the iso-NH contours and the magnetic field orientation inferred from the BLASTPol observations at 250 (left), 350 (centre), and 500 μm (right). The figures present the HROs for the lowest bin, an intermediate bin, and the highest NH bin (blue, orange, and dark red, respectively). These bins have equal numbers of selected pixels within the indicated NH ranges. The horizontal dashed line corresponds to the average. The widths of the shaded areas for each histogram correspond to the 1σ uncertainties related to the histogram binning operation. Histograms peaking at 0deg would correspond to ![]() predominantly aligned with iso-NH contours, while histograms peaking at 90deg would correspond to
predominantly aligned with iso-NH contours, while histograms peaking at 90deg would correspond to ![]() predominantly perpendicular to iso-NH contours.
predominantly perpendicular to iso-NH contours.

Current usage metrics show cumulative count of Article Views (full-text article views including HTML views, PDF and ePub downloads, according to the available data) and Abstracts Views on Vision4Press platform.
Data correspond to usage on the plateform after 2015. The current usage metrics is available 48-96 hours after online publication and is updated daily on week days.
Initial download of the metrics may take a while.