Fig. 2
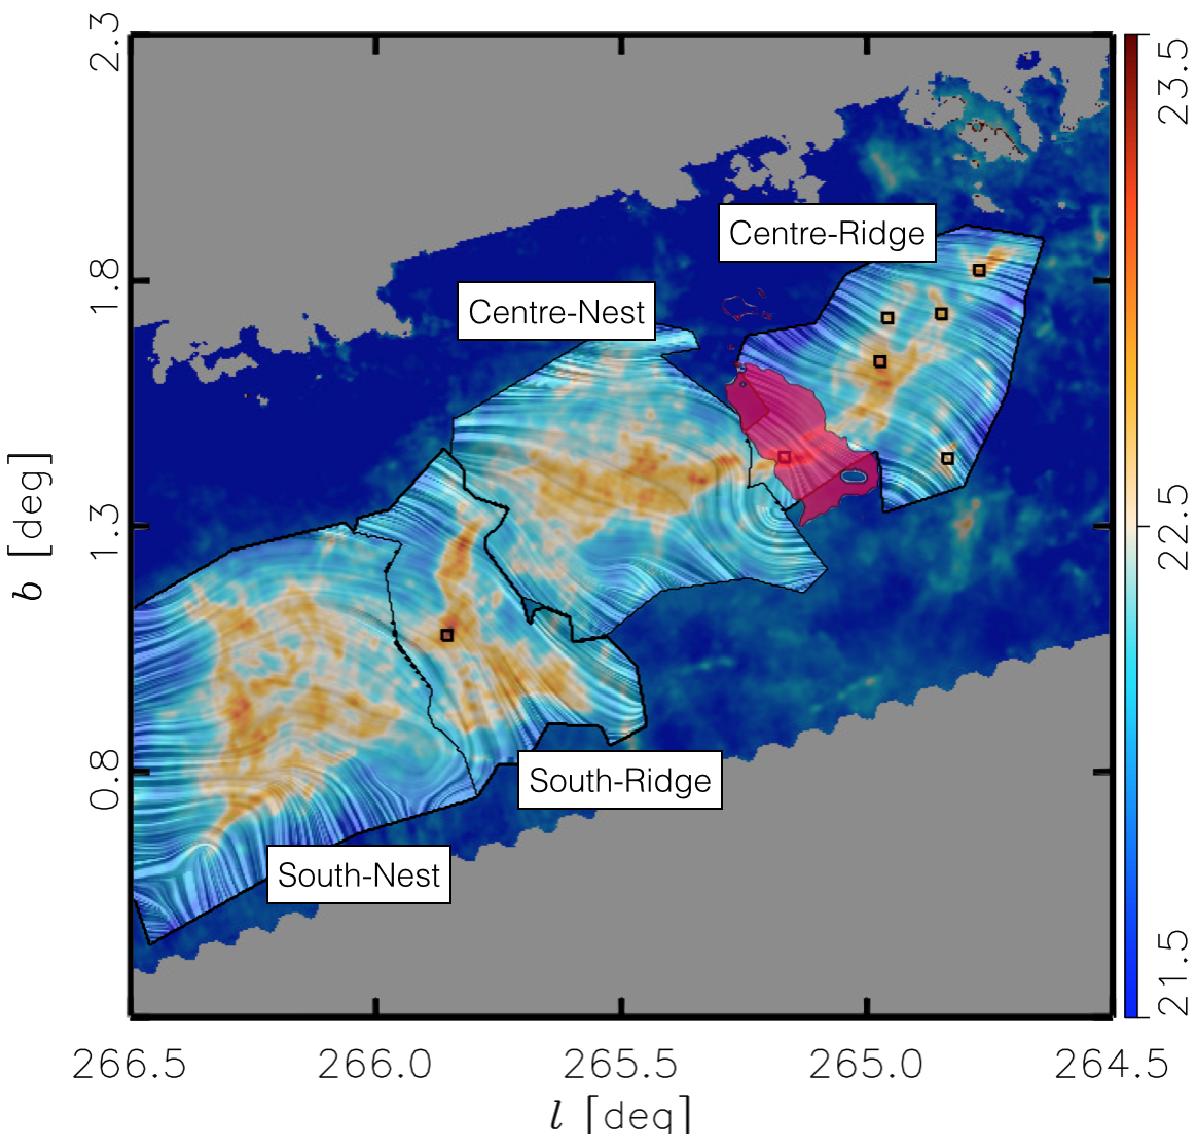
Magnetic field and total intensity measured by BLASTPol towards the analysed sub-regions in the Vela C molecular complex. The colours represent NH, the total gas column density inferred from the Herschel observations. The “drapery” pattern, produced using the line integral convolution method (LIC, Cabral & Leedom 1993), indicates the orientation of magnetic field lines, orthogonal to the orientation of the submillimetre polarization observed by BLASTPol at 500 μm. The black squares show the positions of the dense cores with M> 8 M⊙, the mass threshold considered in Hill et al. (2011), in the catalogue presented in Giannini et al. (2012). The large black polygons correspond to four of the five cloud sub-regions defined in Hill et al. (2011). The area in magenta corresponds to the region around RCW 36, where the dust temperature, derived from the Herschel observations, is larger than 20 K.
Current usage metrics show cumulative count of Article Views (full-text article views including HTML views, PDF and ePub downloads, according to the available data) and Abstracts Views on Vision4Press platform.
Data correspond to usage on the plateform after 2015. The current usage metrics is available 48-96 hours after online publication and is updated daily on week days.
Initial download of the metrics may take a while.