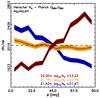
Fig. C.3
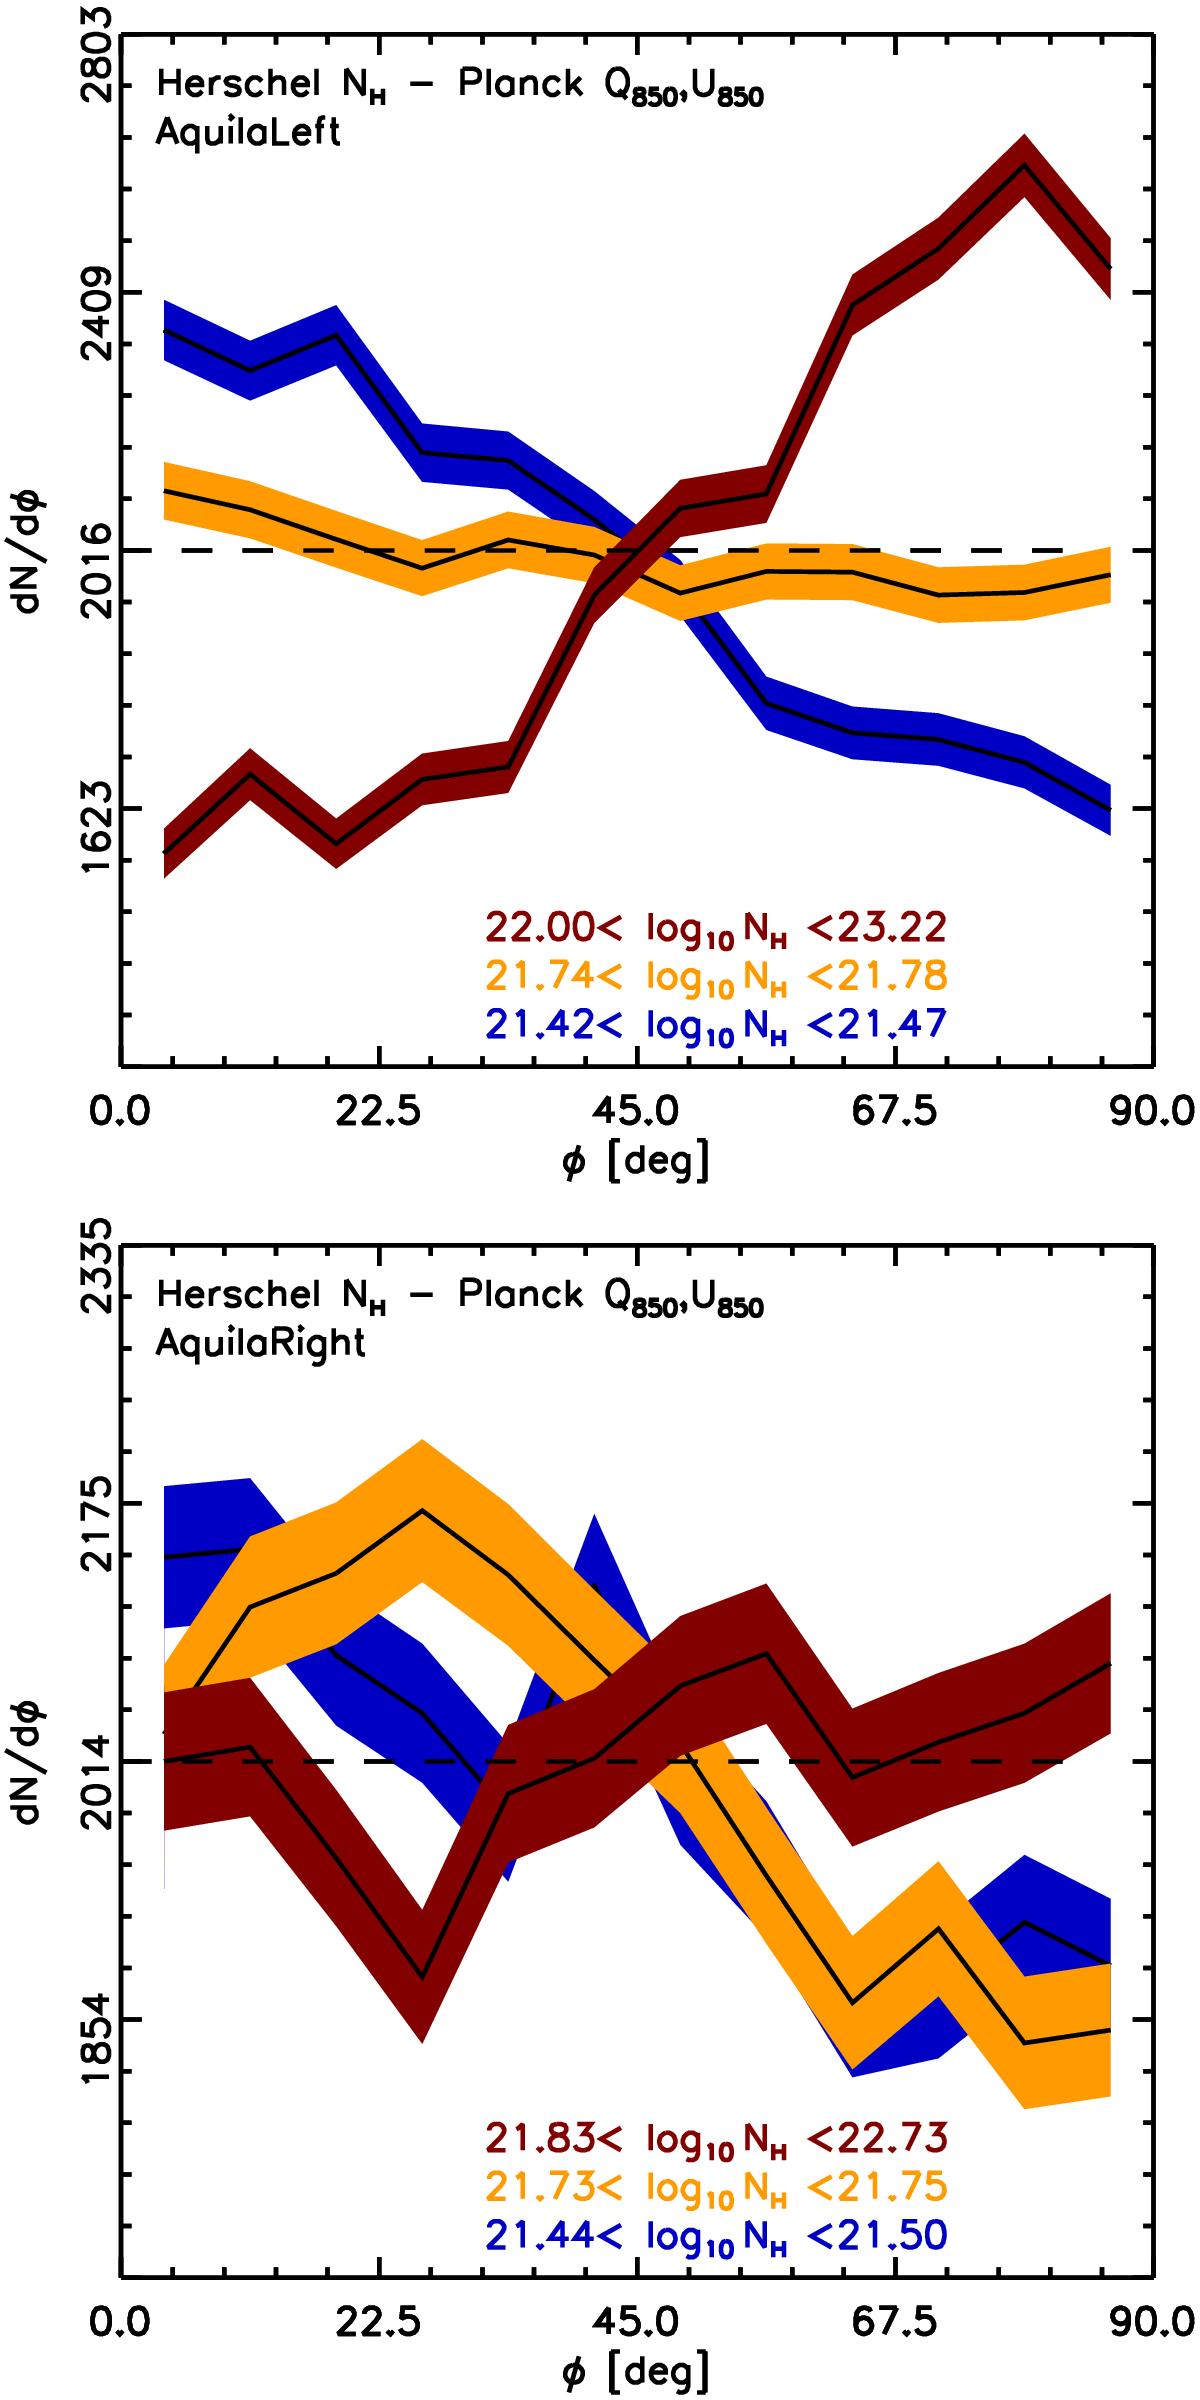
Histogram of the relative orientations (HRO) between the iso-NH2 contours and the magnetic field orientation inferred from the Planck 353 GHz observations towards the two regions of the Aquila rift illustrated in Fig. C.1. The figures present the HROs for the lowest, an intermediate, and the highest NH bin (blue, orange, and dark red, respectively). The bins have equal numbers of selected pixels within the NH-bins ranges labelled. The horizontal dashed line corresponds to the average per angle bin of 15deg. The widths of the shaded areas for each histogram correspond to the 1σ uncertainties related to the histogram binning operation. Histograms peaking at 0deg correspond to ![]() predominantly aligned with iso-NH2 contours. Histograms peaking at 90deg correspond to
predominantly aligned with iso-NH2 contours. Histograms peaking at 90deg correspond to ![]() predominantly perpendicular to iso-NH2 contours.
predominantly perpendicular to iso-NH2 contours.
Current usage metrics show cumulative count of Article Views (full-text article views including HTML views, PDF and ePub downloads, according to the available data) and Abstracts Views on Vision4Press platform.
Data correspond to usage on the plateform after 2015. The current usage metrics is available 48-96 hours after online publication and is updated daily on week days.
Initial download of the metrics may take a while.