Fig. C.1
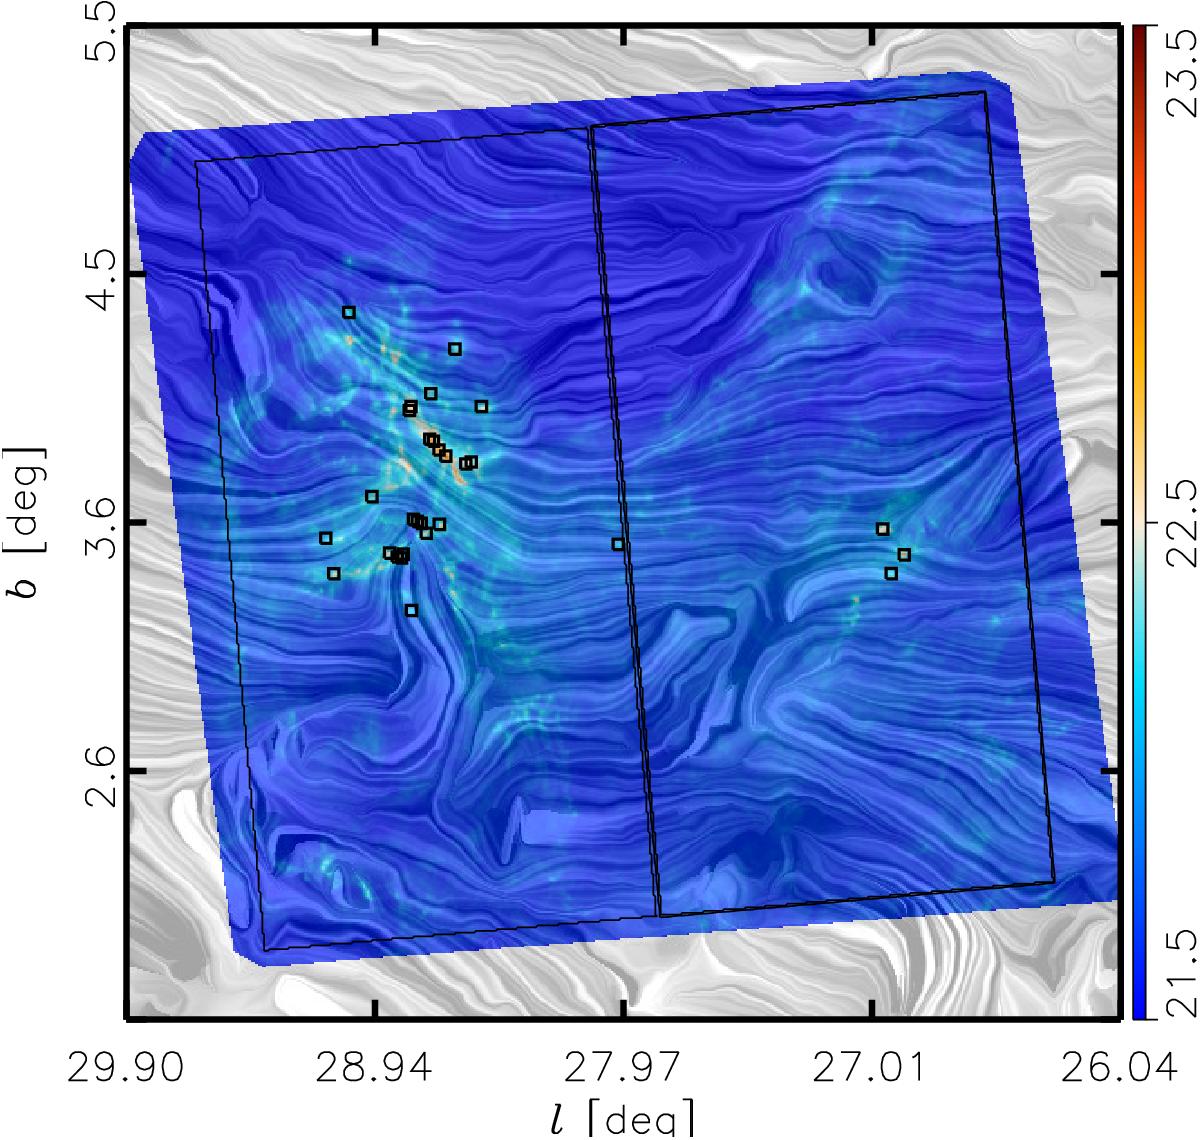
Magnetic field and total gas column density measured towards a sub-region of the Aquila rift. The colours represent the total gas column density, NH, inferred from the Herschel observations (Könyves et al. 2015). The “drapery” pattern, produced using the line integral convolution method (LIC, Cabral & Leedom 1993), indicates the orientation of magnetic field lines, orthogonal to the orientation of the submillimetre polarization observed by Planck at 353 GHz. The black squares correspond to the location of the cores with M> 3 M⊙, pre-stellar and protostellar, from the catalogue presented in Könyves et al. (2015). The black polygons correspond to the two portions where we compare the results of the HRO analysis, which contain W40 (left) and MWC 297 (right), respectively.
Current usage metrics show cumulative count of Article Views (full-text article views including HTML views, PDF and ePub downloads, according to the available data) and Abstracts Views on Vision4Press platform.
Data correspond to usage on the plateform after 2015. The current usage metrics is available 48-96 hours after online publication and is updated daily on week days.
Initial download of the metrics may take a while.