Fig. 3
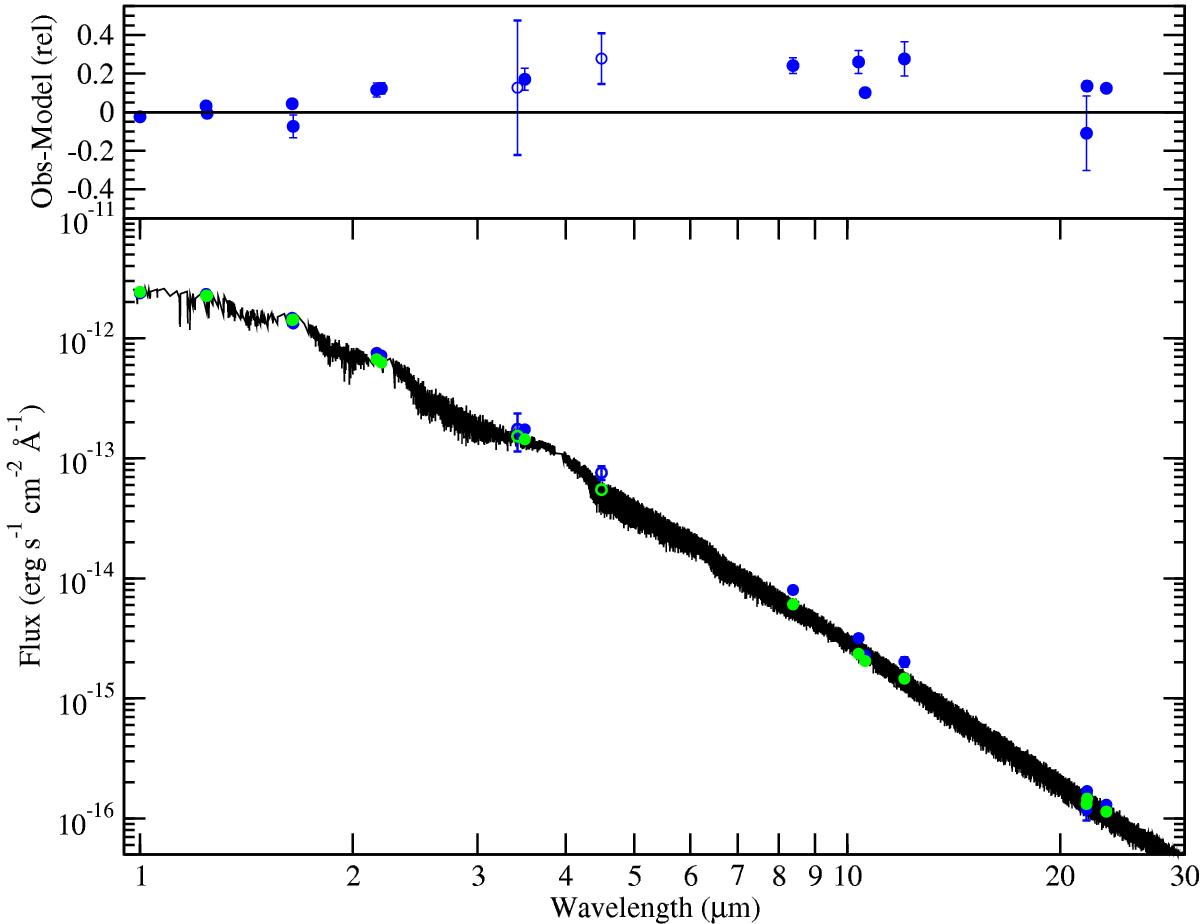
Best-fitting model to IR fluxes considering measurements shortwards of 3 μm. The fit residuals and parameters are given in Tables 6 and 7 under the label Fit 1. The black line is the BT-Settl spectrum. The blue circles correspond to the observed fluxes and the green circles are the model-integrated fluxes. Empty symbols correspond to the WISE W1 and W2 bands, which are heavily saturated.
Current usage metrics show cumulative count of Article Views (full-text article views including HTML views, PDF and ePub downloads, according to the available data) and Abstracts Views on Vision4Press platform.
Data correspond to usage on the plateform after 2015. The current usage metrics is available 48-96 hours after online publication and is updated daily on week days.
Initial download of the metrics may take a while.