Fig. 1
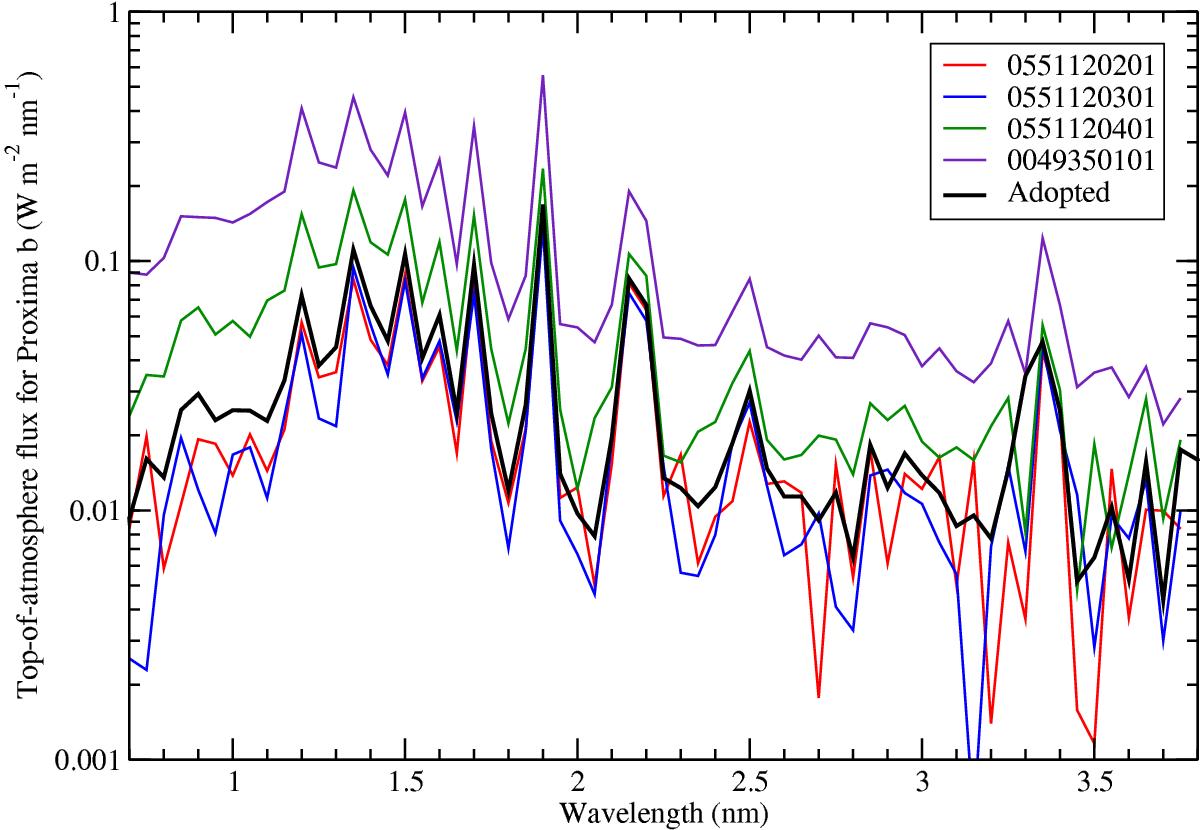
Comparison of the top-of-atmosphere fluxes for Proxima b corresponding to 4 XMM-Newton datasets (in color). The spectrum with higher fluxes (0049350101) corresponds to an observation that includes a strong flare event. Our adopted representative mean flux is depicted in black, and has been corrected to the mean point of the activity cycle and considers contributions from flares.
Current usage metrics show cumulative count of Article Views (full-text article views including HTML views, PDF and ePub downloads, according to the available data) and Abstracts Views on Vision4Press platform.
Data correspond to usage on the plateform after 2015. The current usage metrics is available 48-96 hours after online publication and is updated daily on week days.
Initial download of the metrics may take a while.