Open Access
Fig. 2
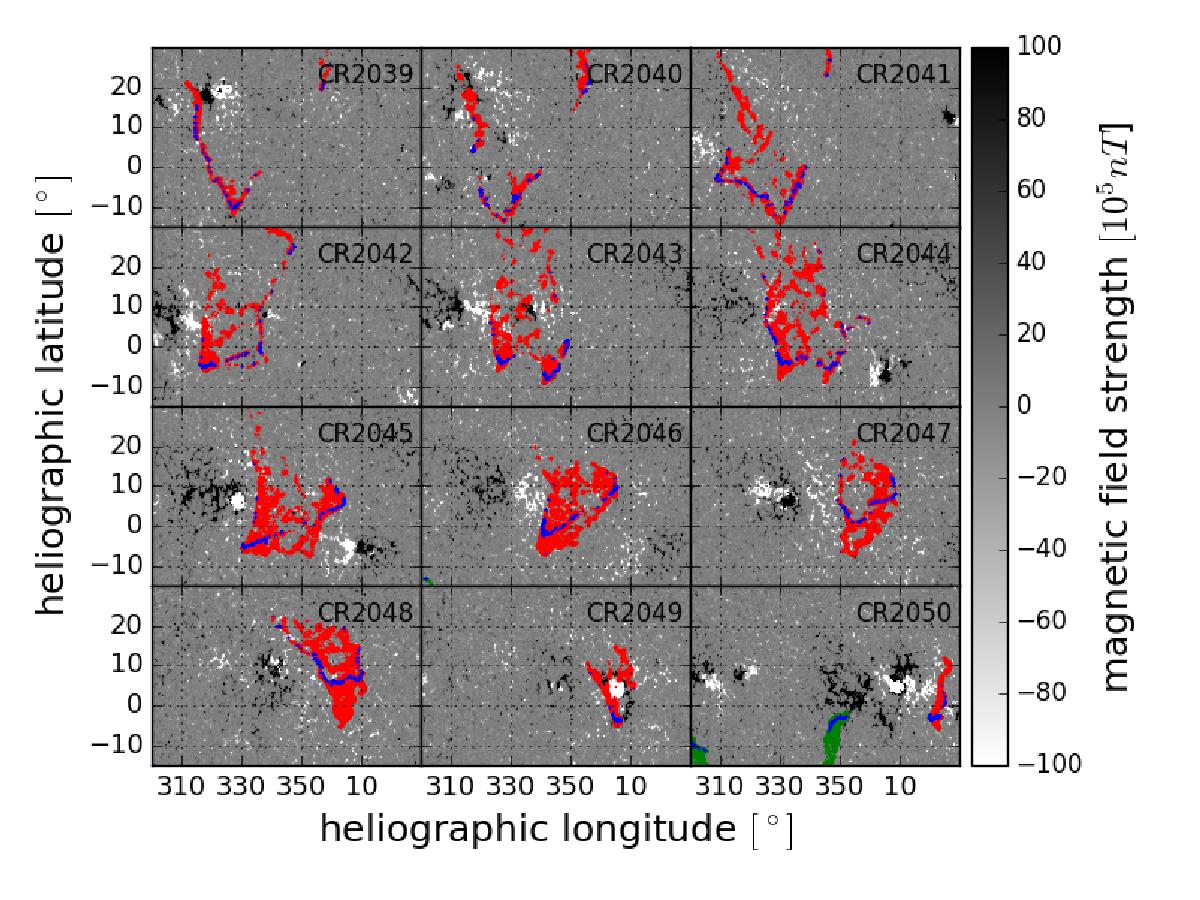
Zoom of the heliographic map at the photospheric level for CRs 2039-2050. In addition to the foot points of open field lines as in Fig. 1, the respective MDI synoptic maps that were used as input to the PFSS model are shown in the background.
Current usage metrics show cumulative count of Article Views (full-text article views including HTML views, PDF and ePub downloads, according to the available data) and Abstracts Views on Vision4Press platform.
Data correspond to usage on the plateform after 2015. The current usage metrics is available 48-96 hours after online publication and is updated daily on week days.
Initial download of the metrics may take a while.