Fig. 12
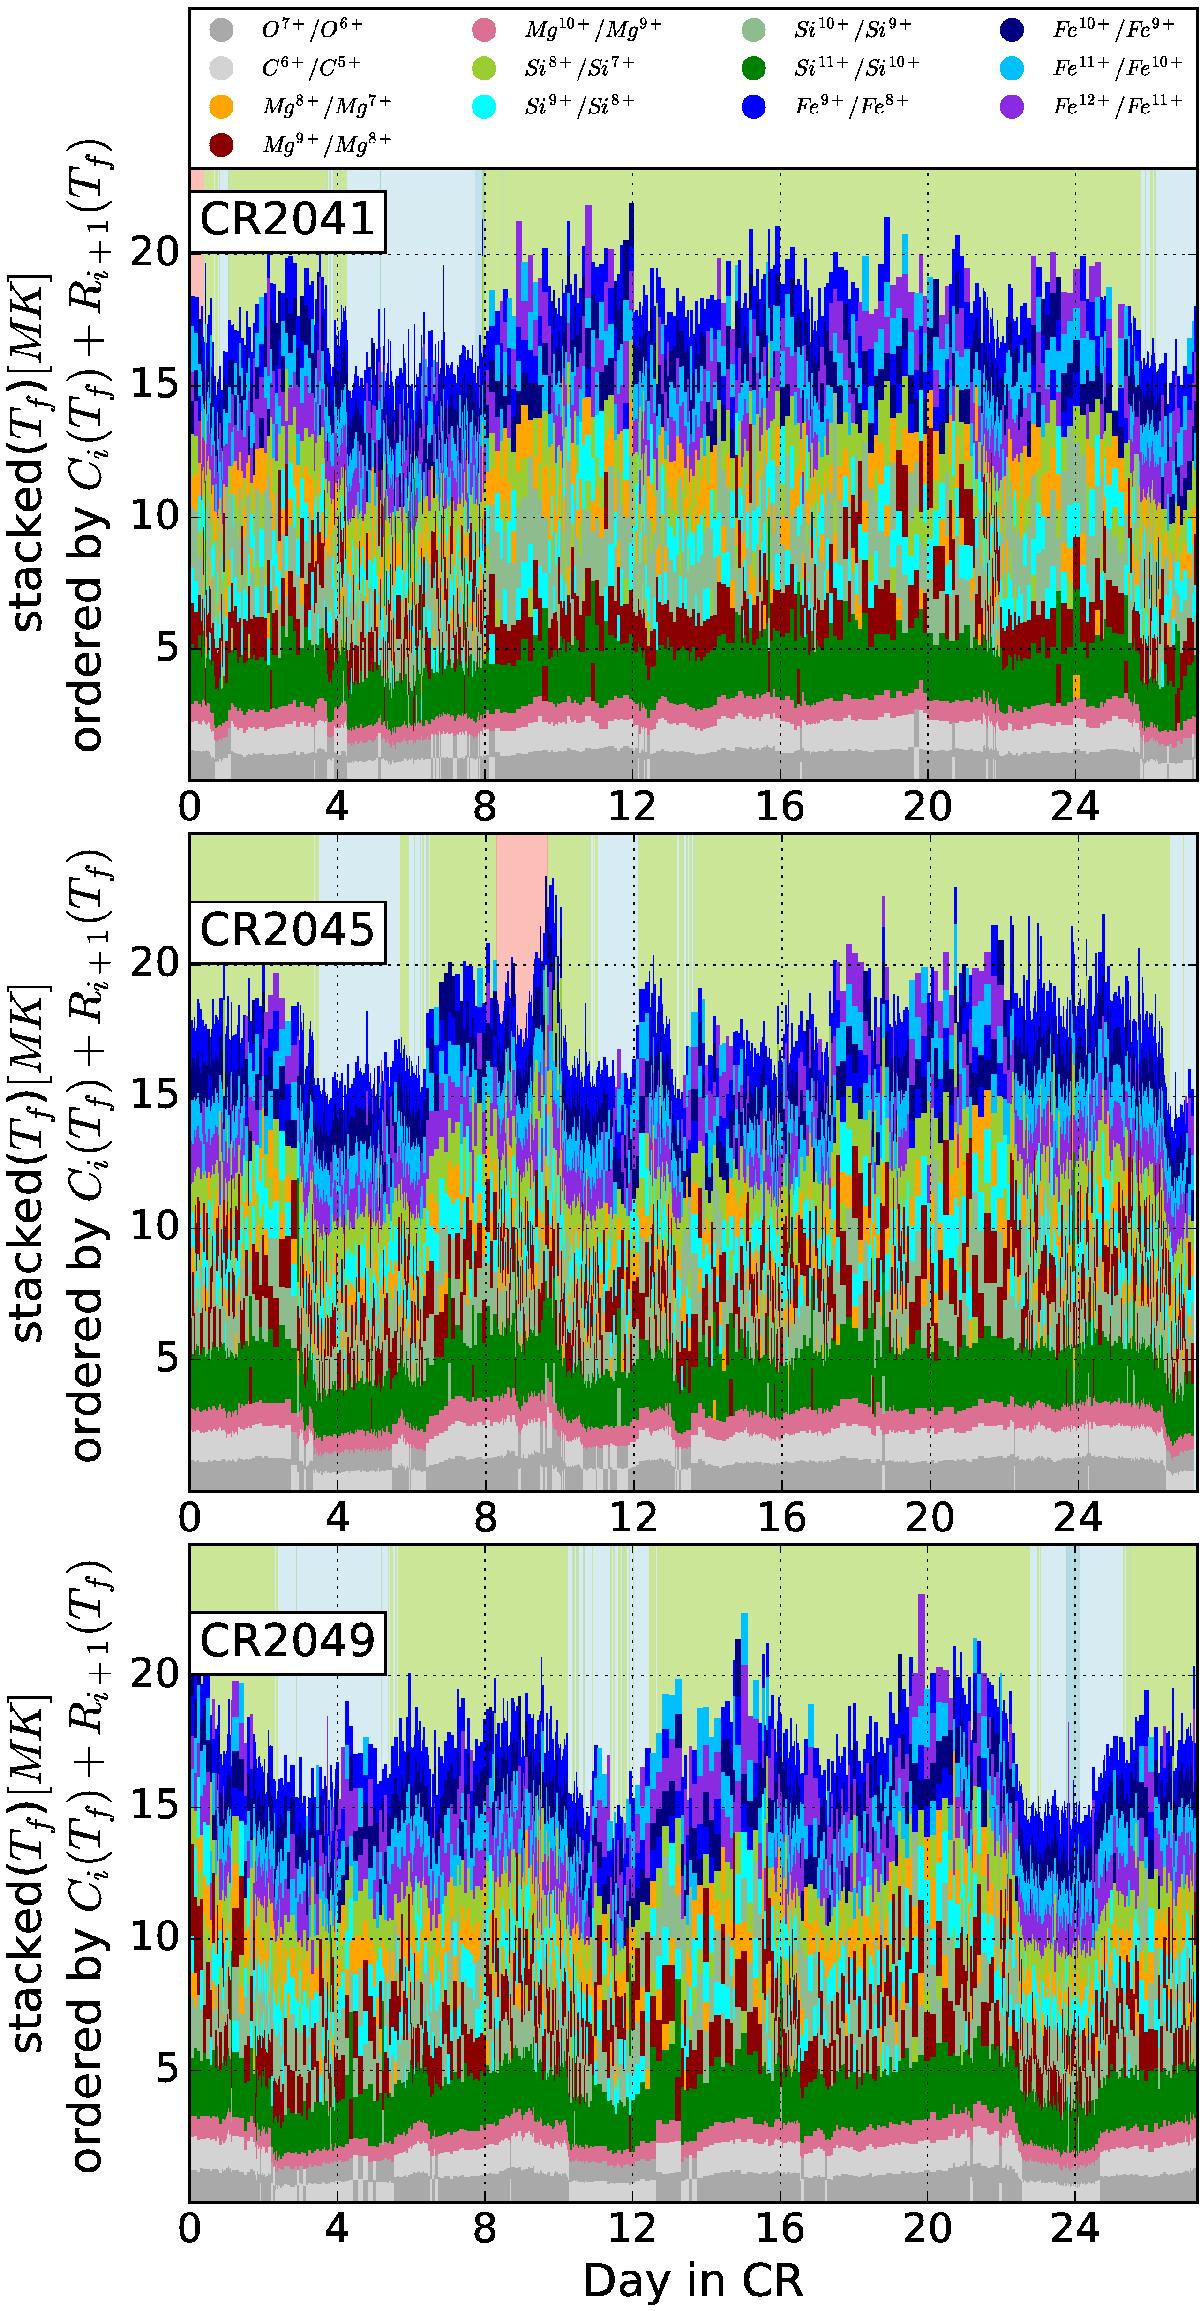
Minimal temperature profiles: freeze-in temperatures for selected ion pairs ordered by the sum of recombination and ionization rates and over time for CR 2041 (top), CR 2045 (middle) and CR 2049 (bottom). The bin size is adaptive to ensure comparable statistics in each bin. For each element, at least 100 total counts are contained per bin. The maximum bin size is 4 h. All panels refer to a κ-function with κ = 10 as the electron velocity distribution function. Each ion pair is identified by color. Their order (from bottom to top) is determined by their recombination and ionization rates Ci(Tf) + Ri + 1(Tf).
Current usage metrics show cumulative count of Article Views (full-text article views including HTML views, PDF and ePub downloads, according to the available data) and Abstracts Views on Vision4Press platform.
Data correspond to usage on the plateform after 2015. The current usage metrics is available 48-96 hours after online publication and is updated daily on week days.
Initial download of the metrics may take a while.