Fig. 10
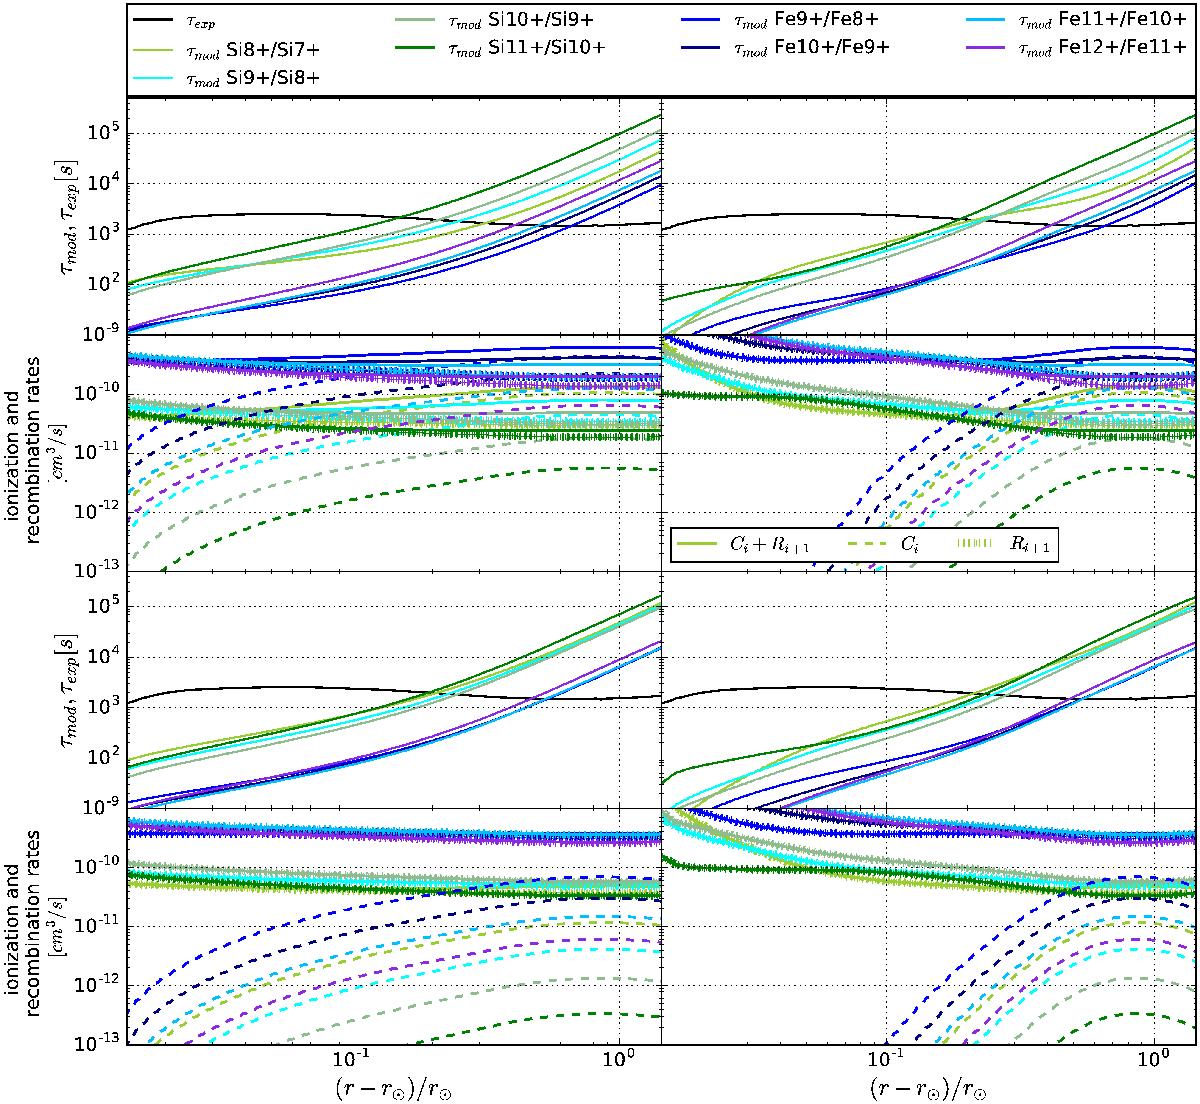
Charge modification and expansion timescales for Si and Fe ions based on the Cranmer et al. (2007) model (top left) and for modified temperature profiles: steeper increasing and declining slopes (top right), lower maximum temperature (bottom left), lower maximum temperature and steeper slopes (bottom right). The first and third rows show the expansion and charge modification timescales. The other panels show for each ion pair the ionization and recombination rates, as well as their sum. The ionization and recombination rates are based on κ-distributed electron velocity functions with κ = 10.
Current usage metrics show cumulative count of Article Views (full-text article views including HTML views, PDF and ePub downloads, according to the available data) and Abstracts Views on Vision4Press platform.
Data correspond to usage on the plateform after 2015. The current usage metrics is available 48-96 hours after online publication and is updated daily on week days.
Initial download of the metrics may take a while.