Fig. 1
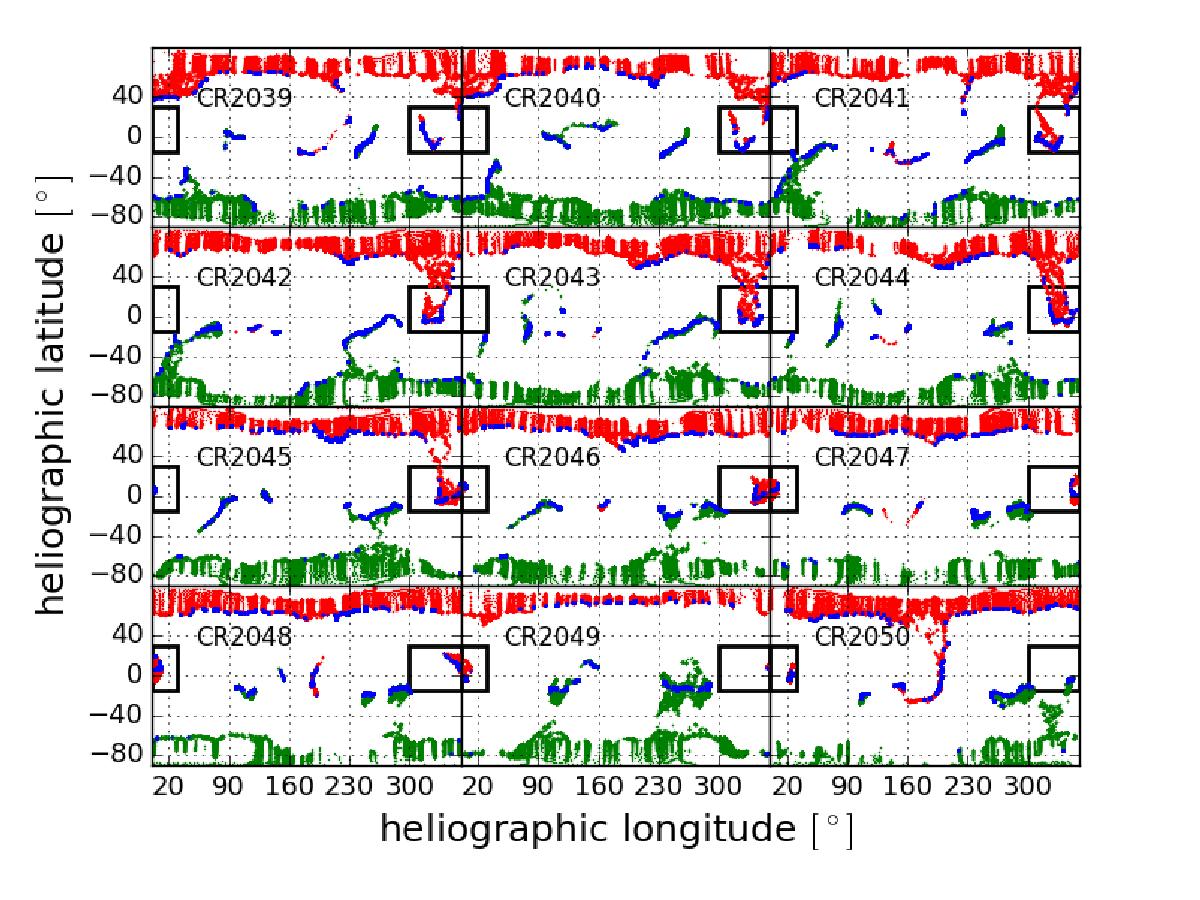
Heliographic map at the photospheric level for CRs 2039-2050 derived from a numerical PFSS approach. The maps are sorted row-wise by CR with CR 2039 at the top left and CR 2050 at the bottom right. Only foot points of open field lines are shown. Inwards directed magnetic polarity is indicated with red dots and outwards directed polarity with green dots. The blue dots refer to the foot points of ACE mapped down to the photosphere. The black boxes indicate the region of interest for which a zoom-in is shown in the following Fig. 2.
Current usage metrics show cumulative count of Article Views (full-text article views including HTML views, PDF and ePub downloads, according to the available data) and Abstracts Views on Vision4Press platform.
Data correspond to usage on the plateform after 2015. The current usage metrics is available 48-96 hours after online publication and is updated daily on week days.
Initial download of the metrics may take a while.