Fig. 5
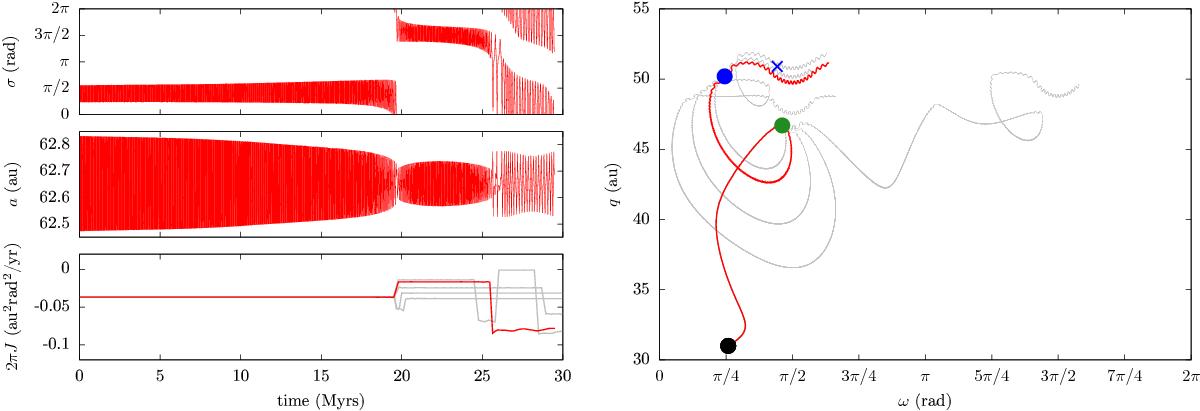
Numerical integration of the two-degree-of-freedom semi-secular system. The initial conditions (origin of the time and black spot on the right) are taken according to the level curves plotted in Fig. 4c. On the right, the evolution of the couple (U,u) is drawn (with q instead of U, obtained by inverting Eq. (3)). Several initial phases for (σ,Σ) were tried, leading to secular trajectories diverging at the first separatrix crossing (grey curves). Among them, the red trajectory is in agreement with our backward reconstruction: its second transition occurs on the blue spot, and it passes near the current position of 2015 FJ345 (to be compared with the level curves from Fig. 4). On the left, the evolution of the couple (σ,Σ) is represented for the red trajectory (with a instead of Σ). The two separatrix crossings, leading to a change of oscillation island, are easily noticeable. The bottom graph presents the evolution of the area 2πJ for all the trajectories plotted on the right, showing the divergence at the first transition. Even if 2πJ is plotted as a continuous line, remember that its definition changes after each transition (different resonance island).
Current usage metrics show cumulative count of Article Views (full-text article views including HTML views, PDF and ePub downloads, according to the available data) and Abstracts Views on Vision4Press platform.
Data correspond to usage on the plateform after 2015. The current usage metrics is available 48-96 hours after online publication and is updated daily on week days.
Initial download of the metrics may take a while.