Fig. 2
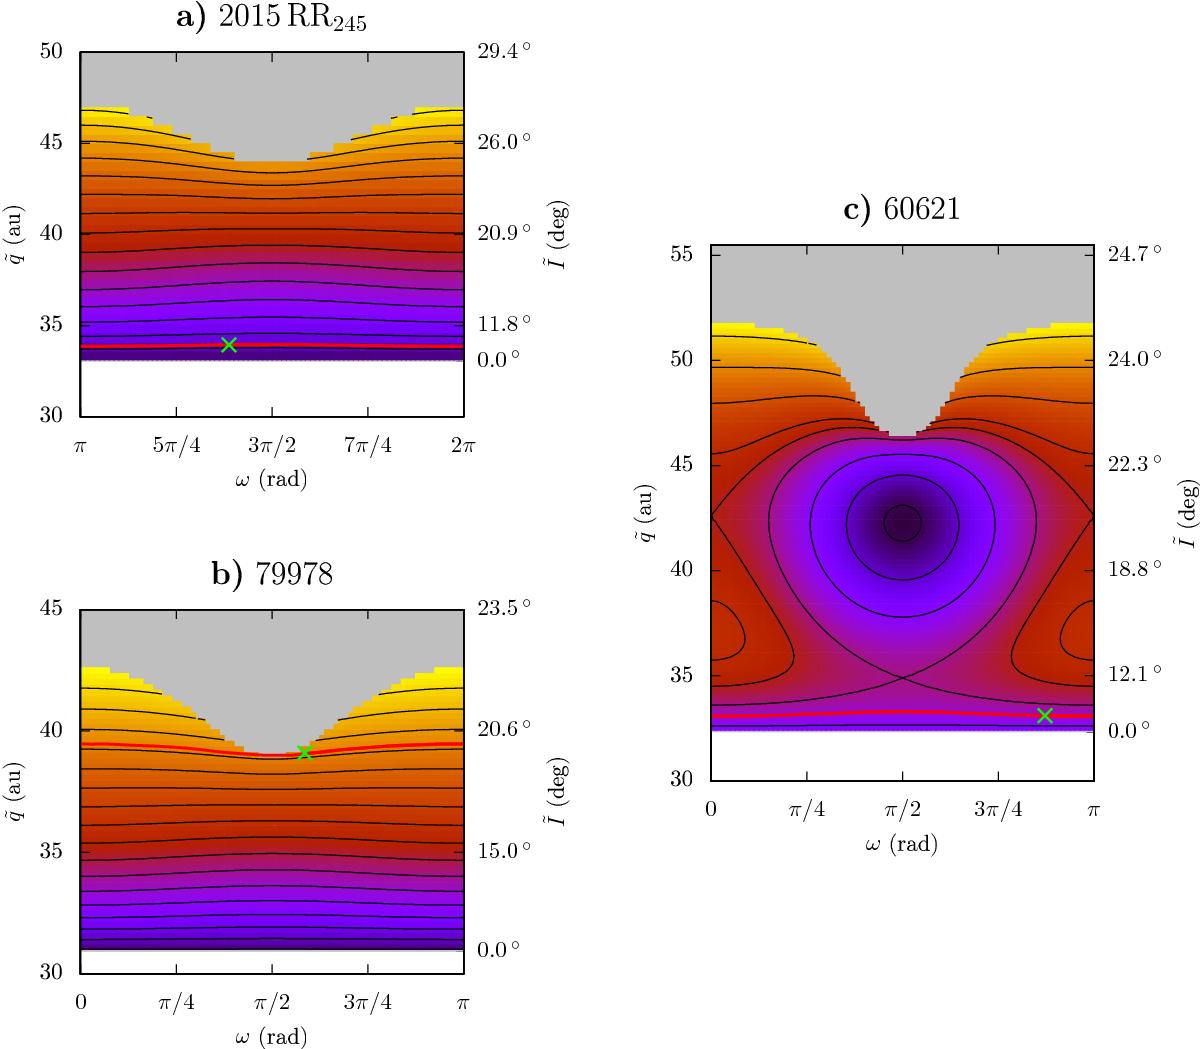
Typical examples of phase portraits for the objects studied in this paper. The colour shades represent the value of the secular Hamiltonian (dark/light for low/high), from which can be deduced the direction of motion along the level curves (black lines). The white zones are forbidden by the value of the parameter η0 (it would require a cosine of inclination larger than 1), and the grey zones are forbidden by the value of the parameter J (the resonance island is too narrow to contain the signed area 2πJ). The green cross represents the current position of the object, and the red curve comes from a numerical integration of the two-degree-of-freedom semi-secular system. The names are written above the graphs (see Table 1 for the parameters of the models). On the graph b), the secular trajectory of 79 978 forces periodically σ to circulate when the curve enters the grey zone (separatrix crossing). The numerical integration shows that this does not significantly affect the overall dynamics (red curve). The graph c) shows that 60621 follows a “flat” trajectory even if the parameters of the model could allow interesting variations of orbital elements. The behaviour of the object 2004 EG96 (not shown) is very similar to that of 60621, but it follows a level curve much closer to the secular separatrix (lying just above the red curve). A small diffusion of its orbital elements (or a refinement of its orbital solution) could thus put it on a level curve leading to much higher perihelion distances.
Current usage metrics show cumulative count of Article Views (full-text article views including HTML views, PDF and ePub downloads, according to the available data) and Abstracts Views on Vision4Press platform.
Data correspond to usage on the plateform after 2015. The current usage metrics is available 48-96 hours after online publication and is updated daily on week days.
Initial download of the metrics may take a while.