Free Access
Fig. 6
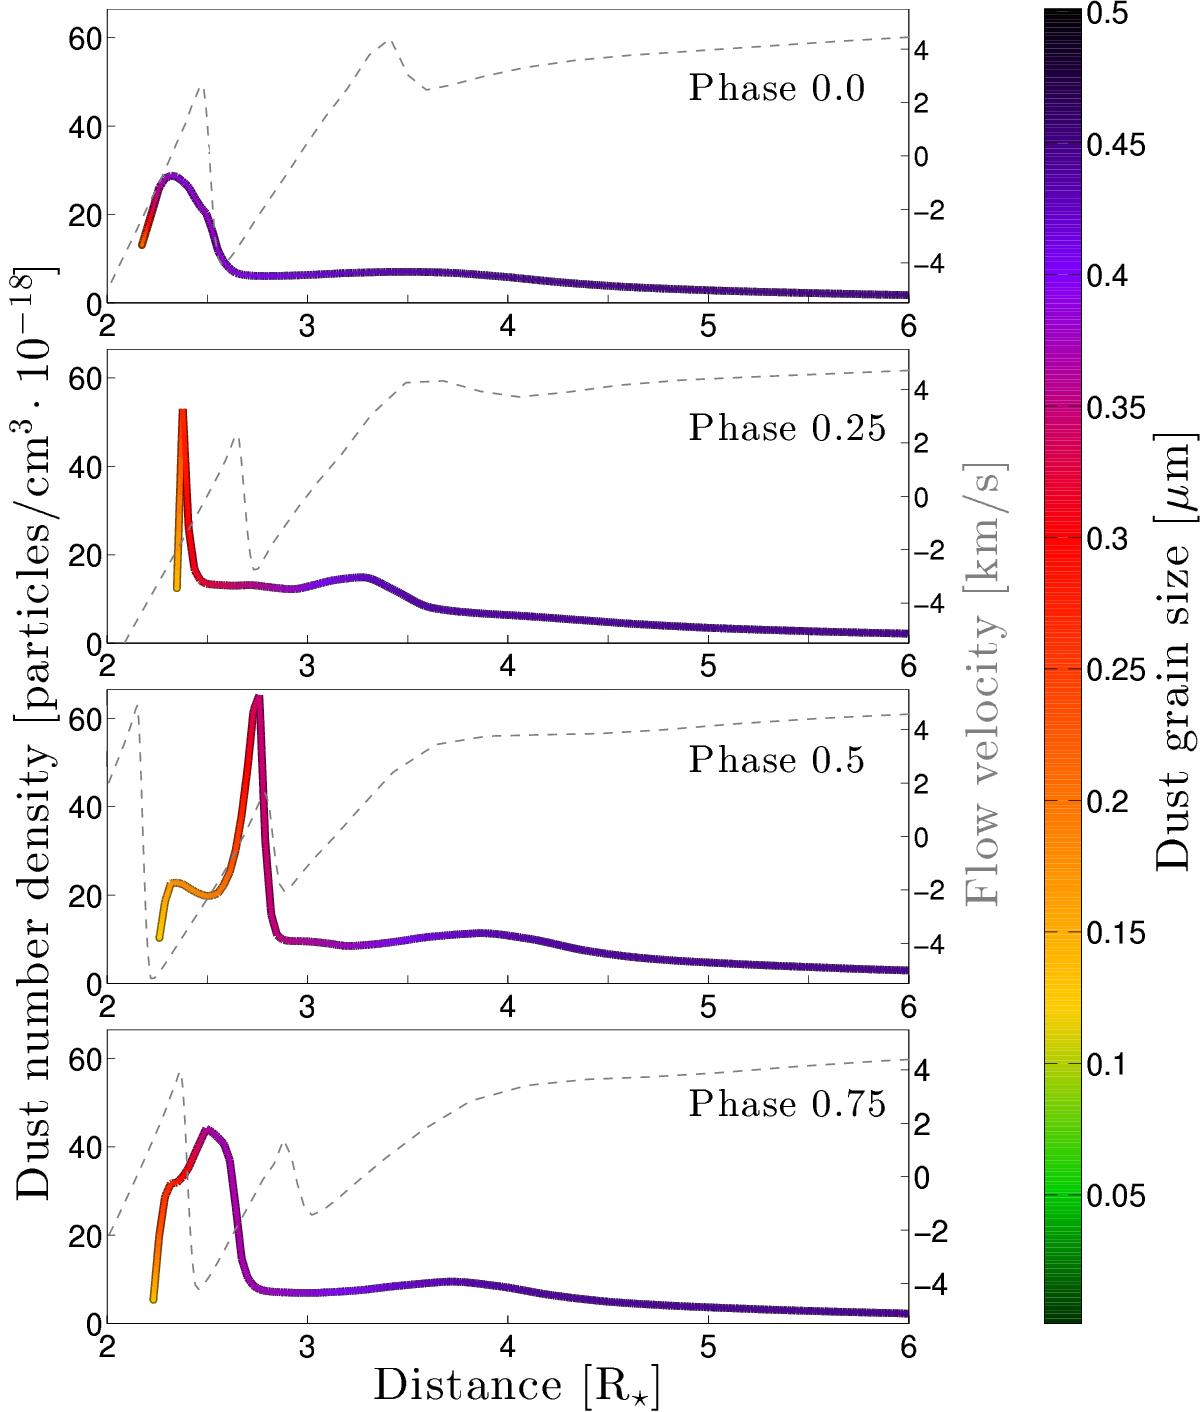
Density structure of the dust component as a function of radial distance for the model B2, taken at four different pulsation phases (same as in Fig. 5). Colour-coded solid lines show density and dust grain size. Dashed grey lines show the flow velocity.
Current usage metrics show cumulative count of Article Views (full-text article views including HTML views, PDF and ePub downloads, according to the available data) and Abstracts Views on Vision4Press platform.
Data correspond to usage on the plateform after 2015. The current usage metrics is available 48-96 hours after online publication and is updated daily on week days.
Initial download of the metrics may take a while.