Fig. 9
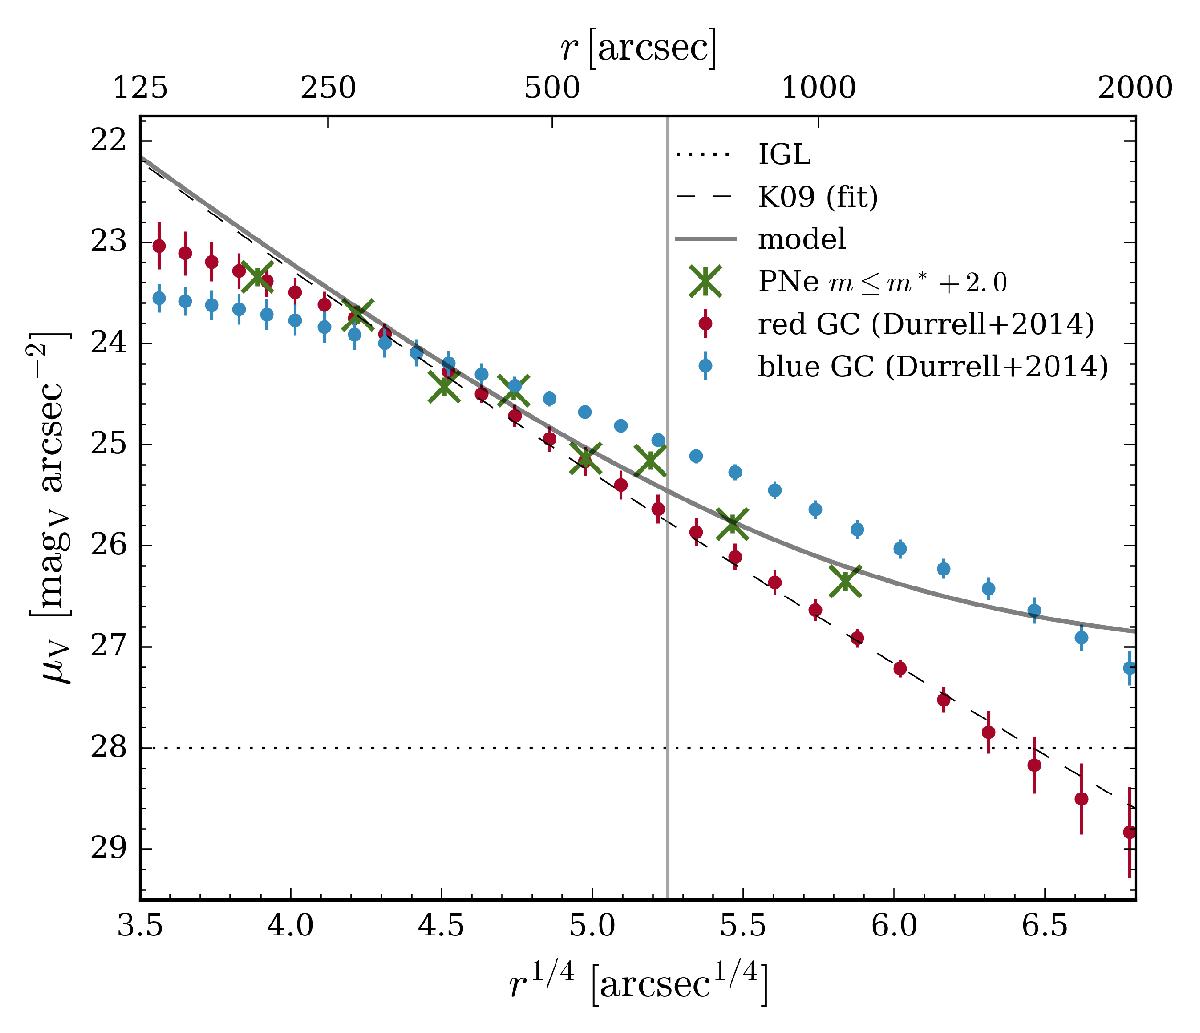
Comparison of the PN number density profile with that of red and blue globular clusters. The Sérsic fit to broad-band photometry (K09) is indicated by the dashed line. The dotted line shows expected contribution of the IGL. The PN number density profile is shown with green crosses and the two-component model fit to it is denoted with the solid grey line. The density profile from red and blue globular clusters are indicated by filled circles in the respective colours. The vertical line denotes the transition radius from the inner to the outer halo based on the change in the PN number density slope.
Current usage metrics show cumulative count of Article Views (full-text article views including HTML views, PDF and ePub downloads, according to the available data) and Abstracts Views on Vision4Press platform.
Data correspond to usage on the plateform after 2015. The current usage metrics is available 48-96 hours after online publication and is updated daily on week days.
Initial download of the metrics may take a while.