Fig. 7
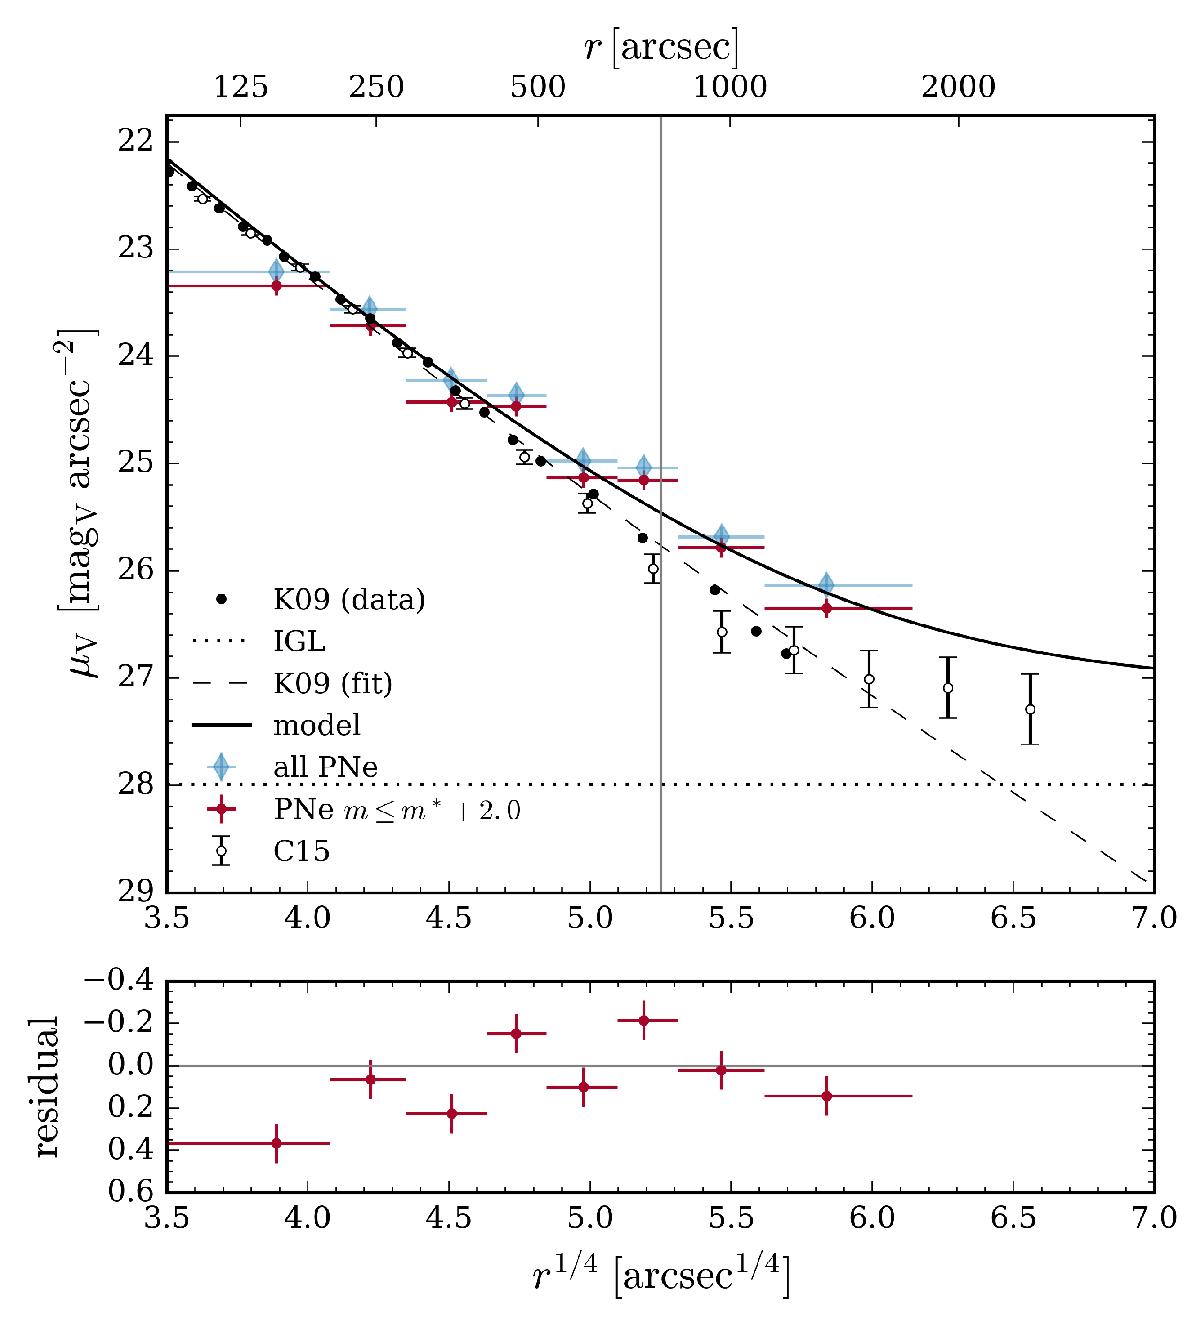
Top panel: radial surface brightness profiles in M 49: the filled circles denote the surface brightness profile observed by K09 and the open circles are from C15. The Sérsic fit (K09) is indicated by the dashed line. The dotted horizontal line shows the expected contribution of the IGL. The PN number density profile is denoted with blue diamonds and red circles, where the latter sample has a magnitude limit of m⋆ + 2.0 mag. The two-component model fit to the PN number density profile is shown with the solid black line. The vertical line denotes the transition radius from the inner PN-scarce to the outer PN-rich halo based on the change in the PN number density slope. Bottom panel: residuals of the fit.
Current usage metrics show cumulative count of Article Views (full-text article views including HTML views, PDF and ePub downloads, according to the available data) and Abstracts Views on Vision4Press platform.
Data correspond to usage on the plateform after 2015. The current usage metrics is available 48-96 hours after online publication and is updated daily on week days.
Initial download of the metrics may take a while.