Fig. 13
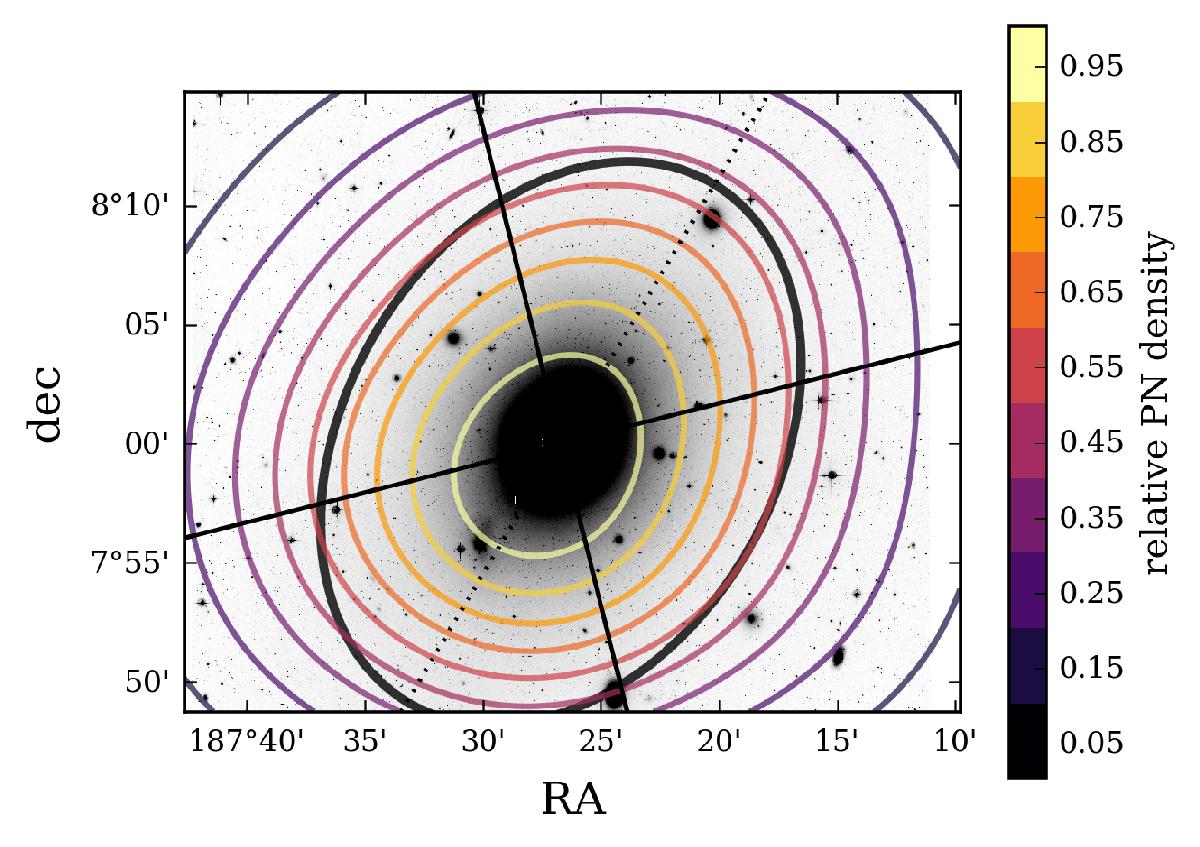
NGVS g-band image of M 49 (from Arrigoni Battaia et al. 2012) with 2D contours of the relative PN density superimposed. The black ellipse denotes the major-axis transition radius from the inner to the outer halo at 730′′ as defined in Sect. 4, the dashed line indicates the major axis and the solid lines the borders of the quadrants as defined in Sect. 6.
Current usage metrics show cumulative count of Article Views (full-text article views including HTML views, PDF and ePub downloads, according to the available data) and Abstracts Views on Vision4Press platform.
Data correspond to usage on the plateform after 2015. The current usage metrics is available 48-96 hours after online publication and is updated daily on week days.
Initial download of the metrics may take a while.