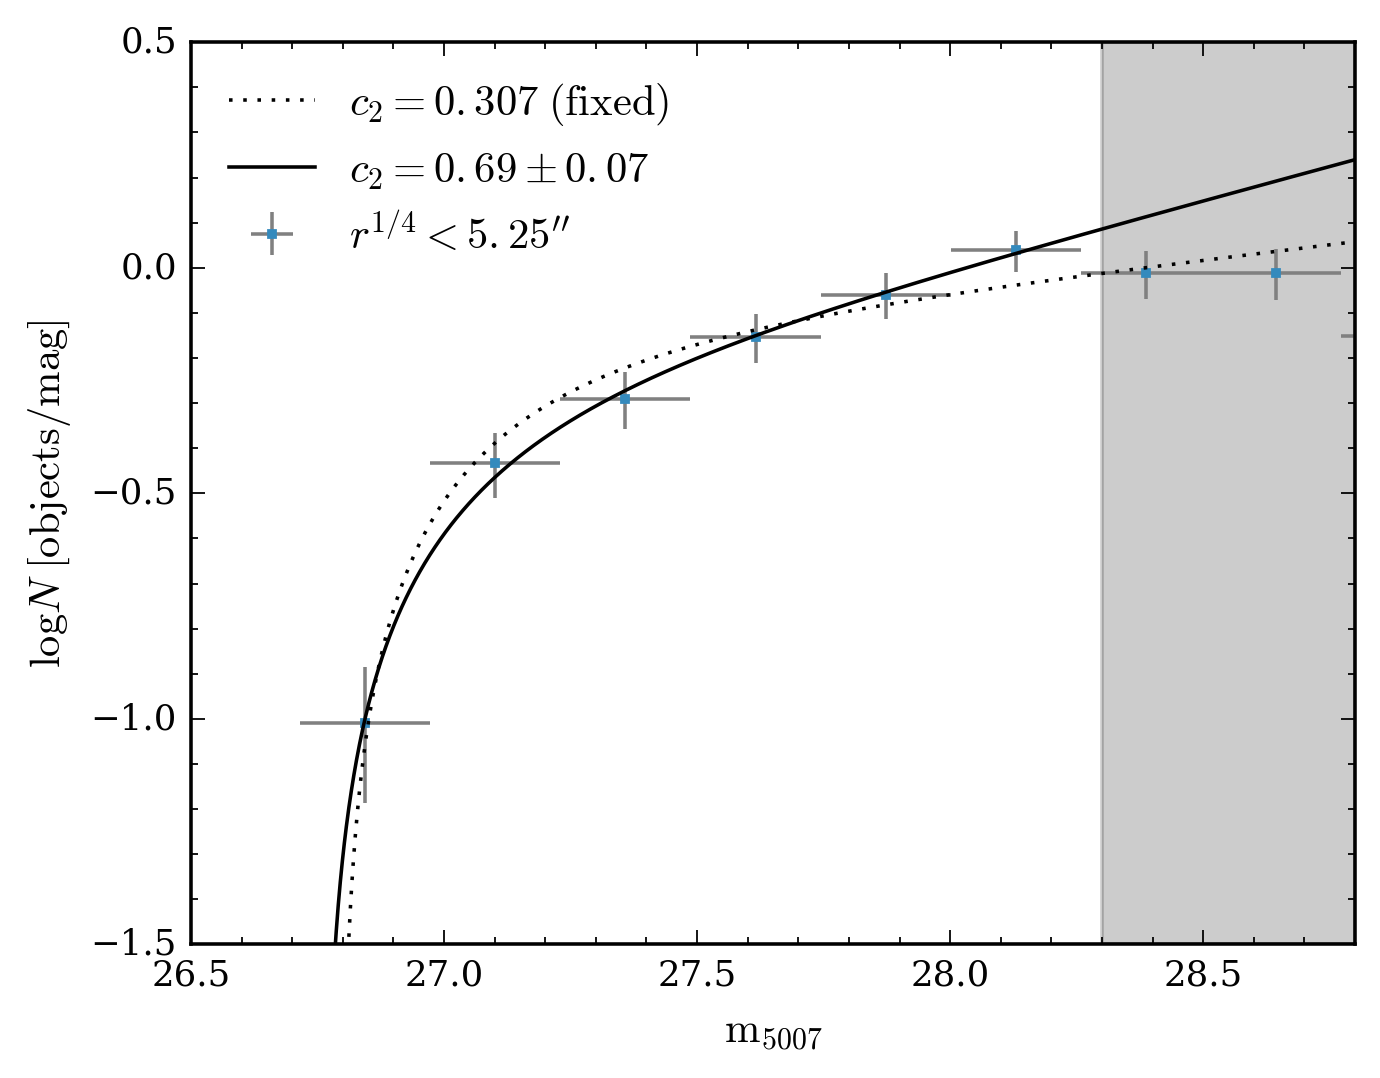
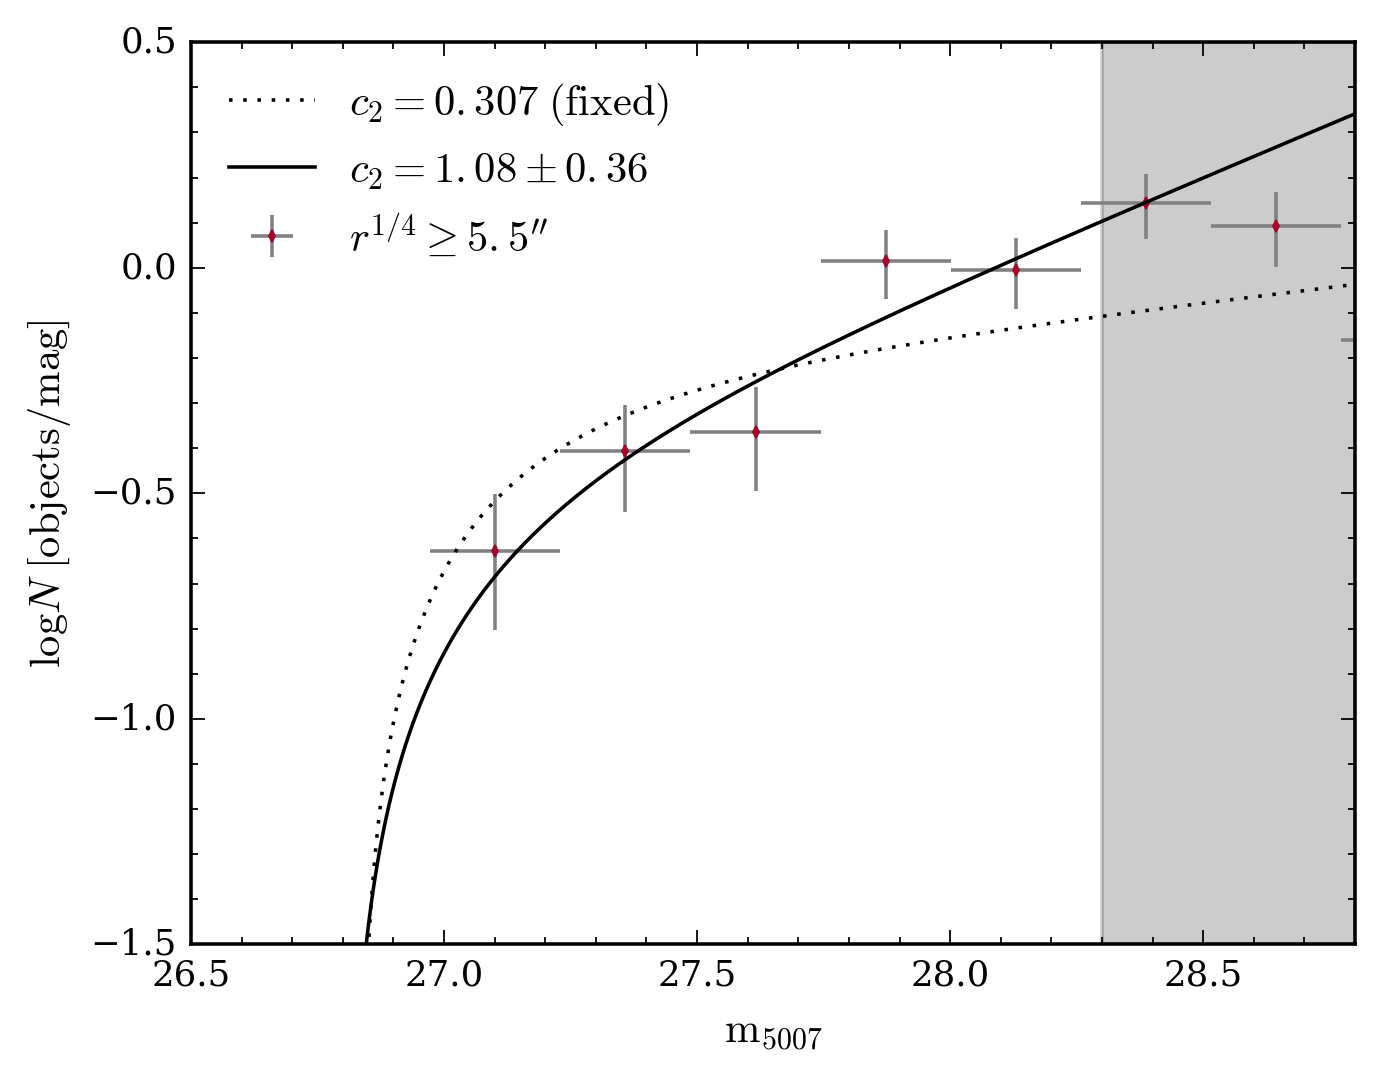
Fig. 11
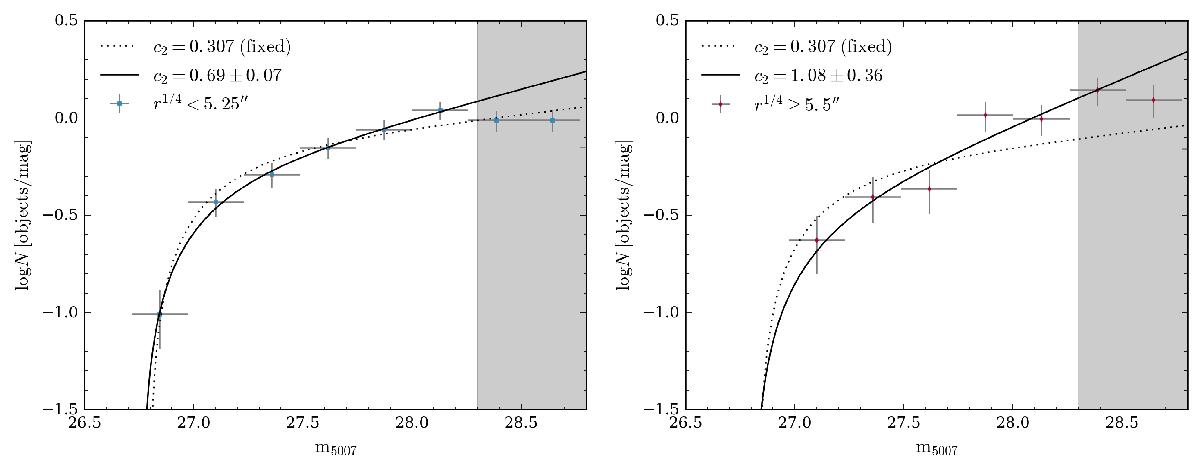
PNLF of the completeness-corrected PN sample in two radial bins. Left panel: PN sample in the inner halo (r1 / 4< 5.25); right panel: sample in the outer halo (r1 / 4 ≥ 5.25). The error bars along the y-axis account for the Poissonian error and the x-errors for the bin width. The solid lines show the fits to the PNLF allowing for variation in the parameter c2 while the dashed lines show the fits with a fixed c2 = 0.307 (Ciardullo et al. 1989). As in Fig. 10, the grey region denotes the magnitude range in which the PNLF might be affected by incompleteness.
Current usage metrics show cumulative count of Article Views (full-text article views including HTML views, PDF and ePub downloads, according to the available data) and Abstracts Views on Vision4Press platform.
Data correspond to usage on the plateform after 2015. The current usage metrics is available 48-96 hours after online publication and is updated daily on week days.
Initial download of the metrics may take a while.