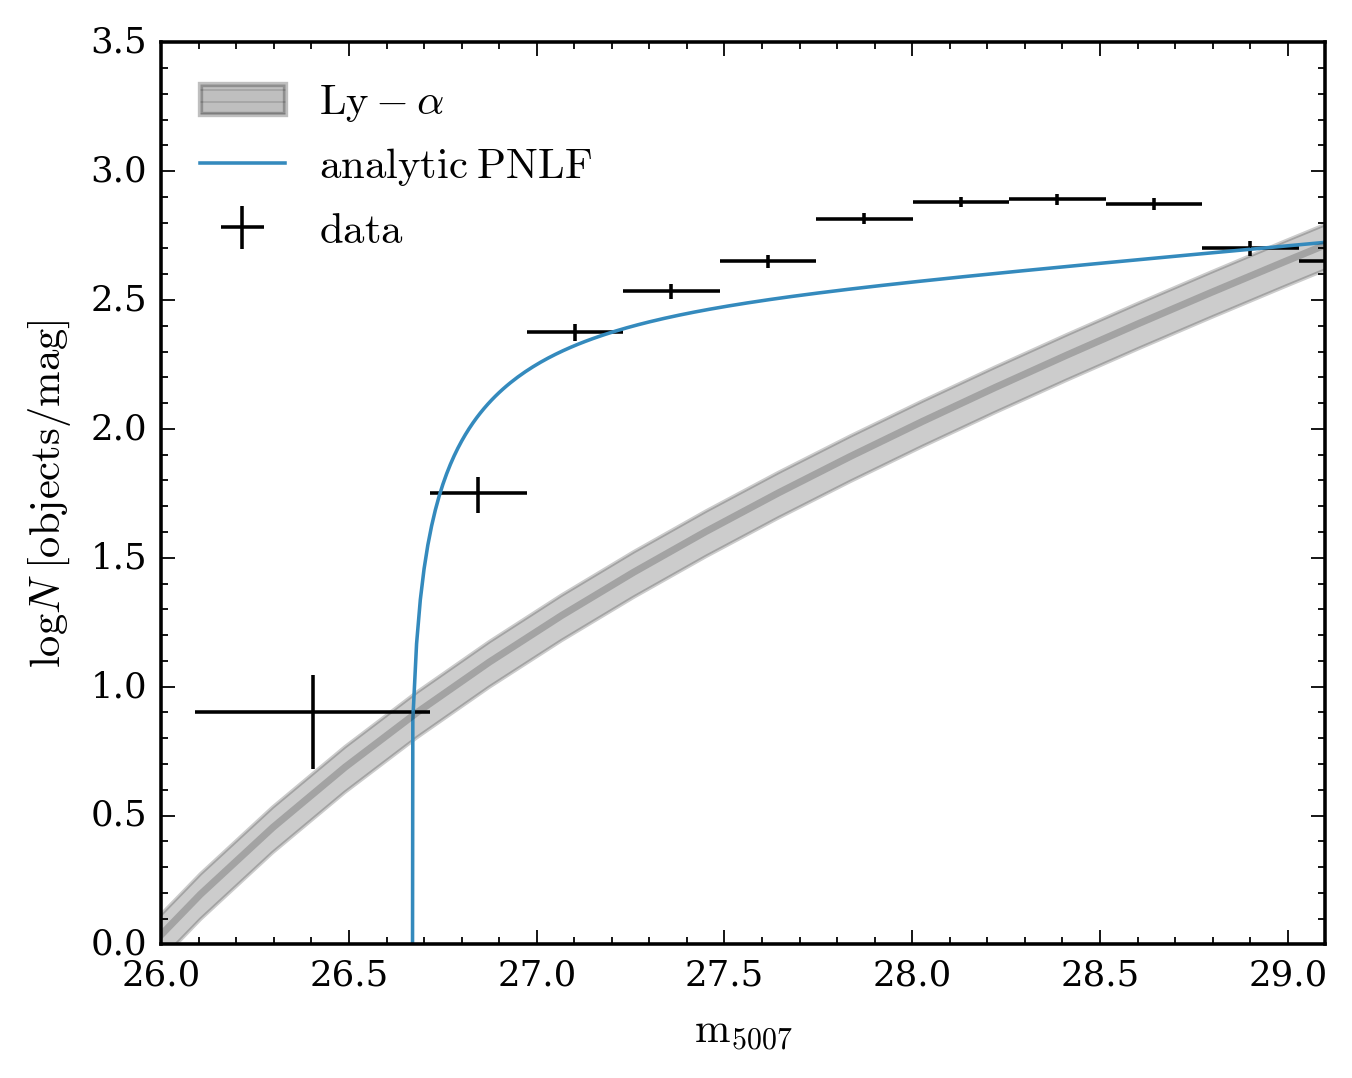
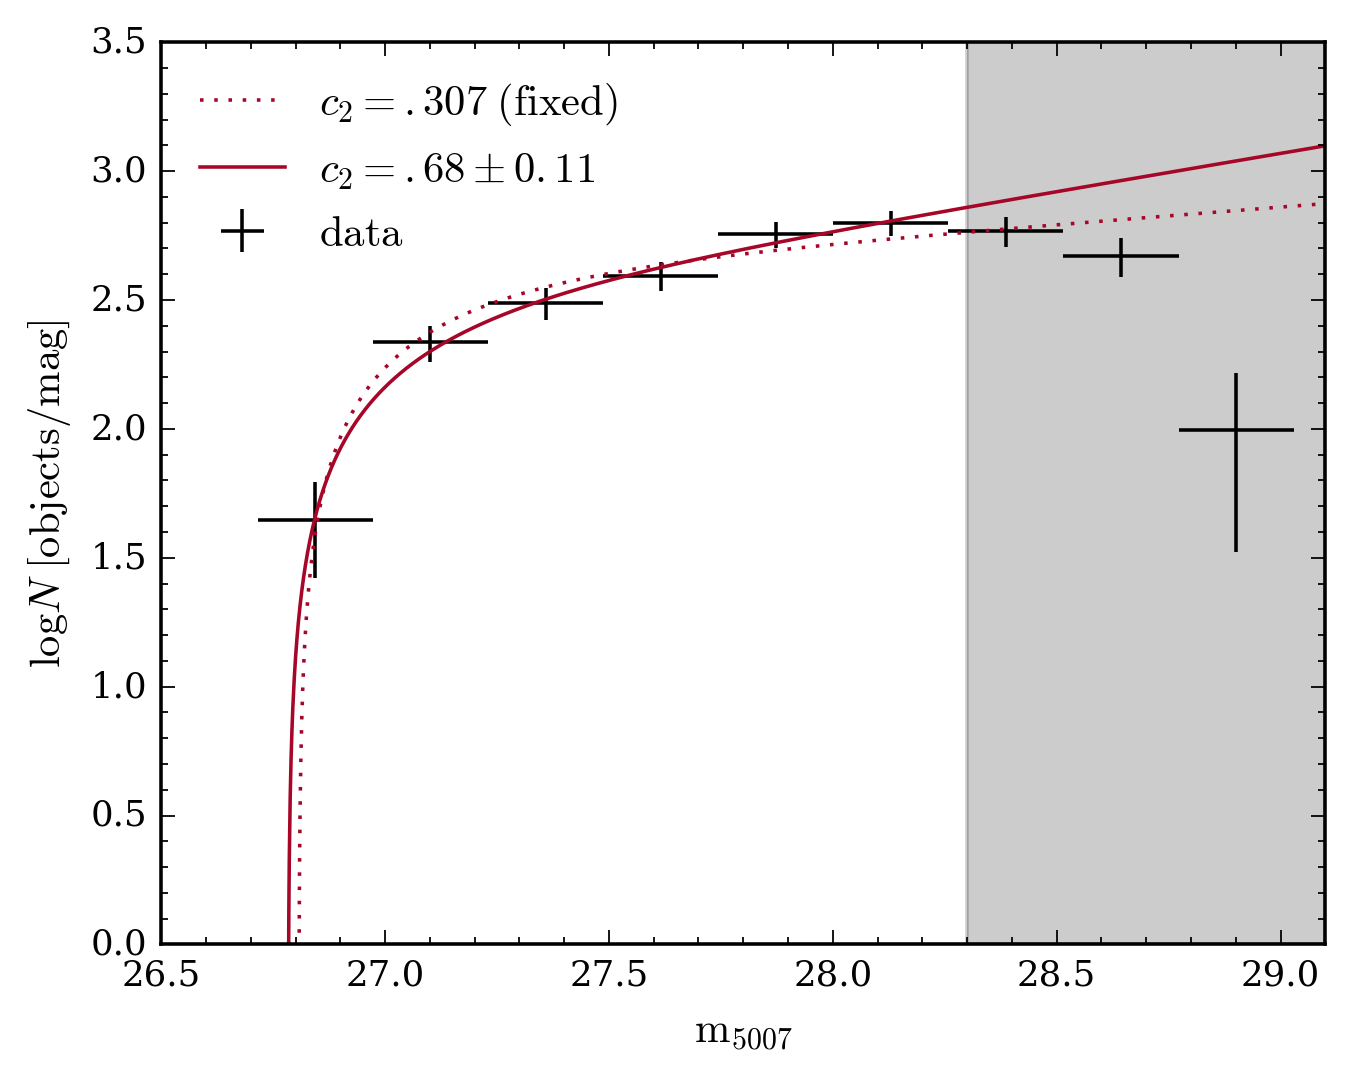
Fig. 10
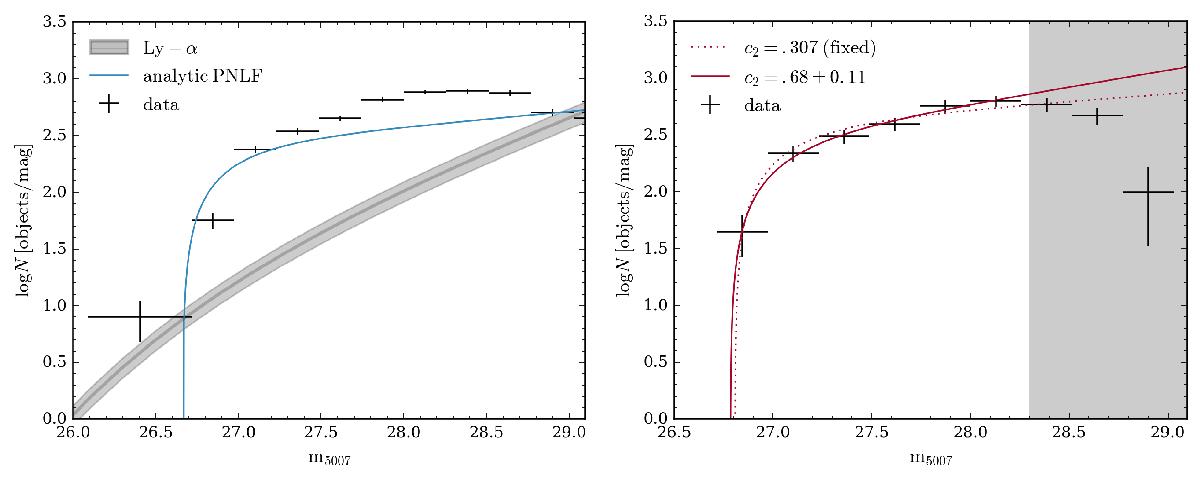
Left: PNLF of the completeness-corrected PN sample (without accounting for contamination by Ly-α-emitting background galaxies). The error bars along the y-axis account for the Poissonian error and the x-errors for the bin width. The solid blue line shows the analytical PNLF at a distance modulus μ = 31.3 with c2 = 0.307 (Ciardullo et al. 1989). The solid grey line shows the Ly-α LF (G07) and its variance due to density fluctuations is represented by the shaded region. Right: PNLF of the completeness-corrected PN sample after statistical subtraction of the estimated Ly-α LF. The grey region denotes the magnitude range in which the PNLF might be affected by incompleteness that could not be corrected for. The error bars along the y-axis account for the Poissonian error and the x-errors for the bin width. The solid red line shows the fit of the generalised PNLF, with the best-fit parameters c2 = 0.69 ± 0.12 and μ = 31.29 ± 0.05. The dotted line shows the fit to the PNLF for c2 = 0.307 (Ciardullo et al. 1989).
Current usage metrics show cumulative count of Article Views (full-text article views including HTML views, PDF and ePub downloads, according to the available data) and Abstracts Views on Vision4Press platform.
Data correspond to usage on the plateform after 2015. The current usage metrics is available 48-96 hours after online publication and is updated daily on week days.
Initial download of the metrics may take a while.