Fig. 1
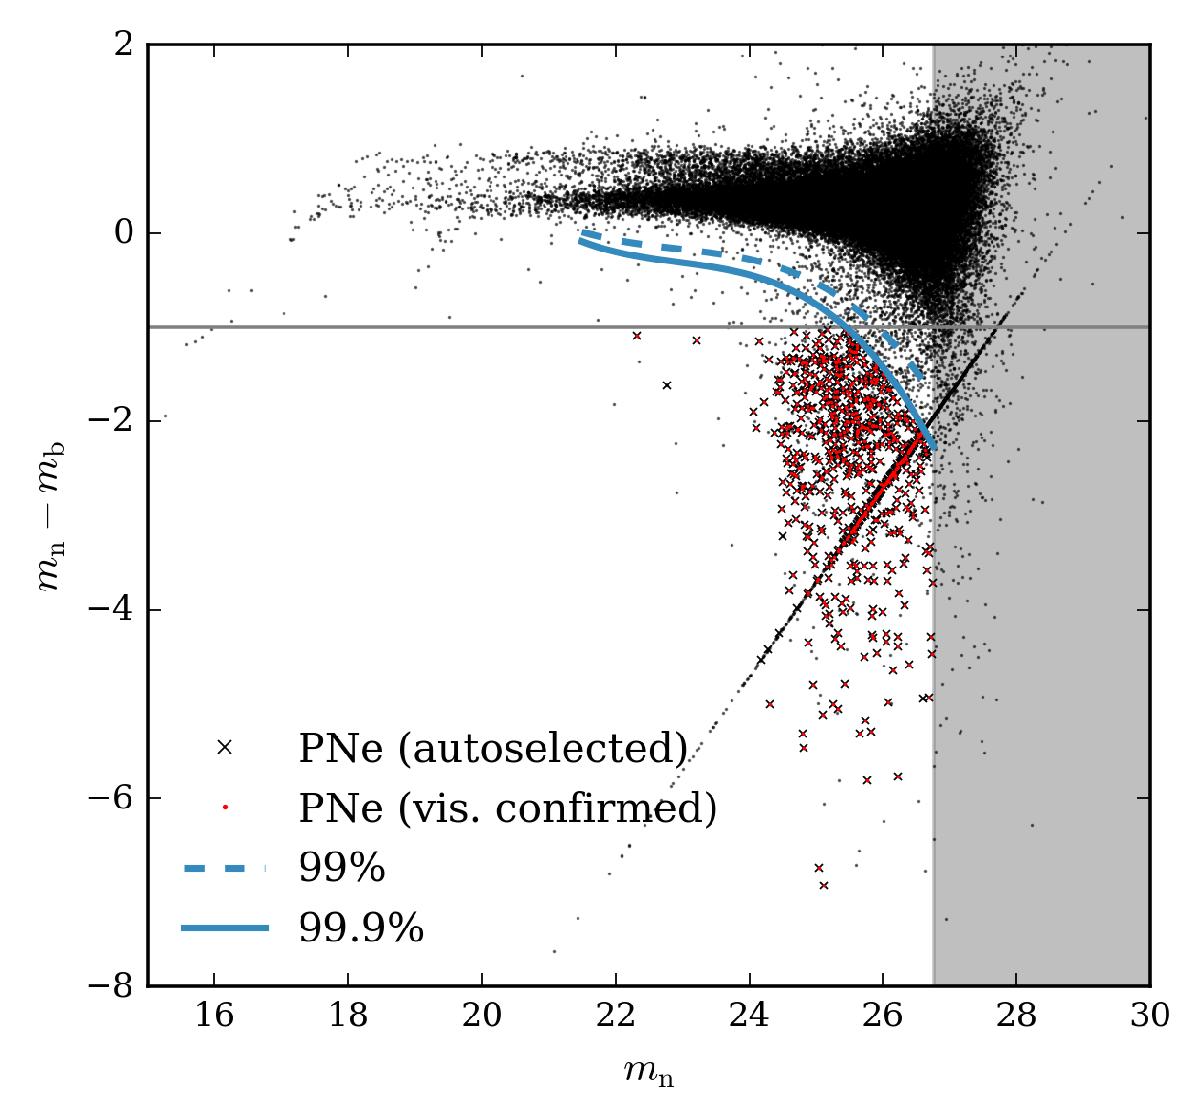
CMD for all sources in the M 49 Suprime Cam field. Objects below the horizontal line are emission line objects with an EWobs> 110 Å and colour excess. The solid (dashed) blue lines indicate the regions above which 99.9% (99%) of simulated continuum objects fall. Objects fainter than the limiting magnitude fall into the grey region. The candidate PNe from the automatic selection are denoted by crosses and those confirmed by visual inspection of the images by red dots.
Current usage metrics show cumulative count of Article Views (full-text article views including HTML views, PDF and ePub downloads, according to the available data) and Abstracts Views on Vision4Press platform.
Data correspond to usage on the plateform after 2015. The current usage metrics is available 48-96 hours after online publication and is updated daily on week days.
Initial download of the metrics may take a while.