Fig. A.1
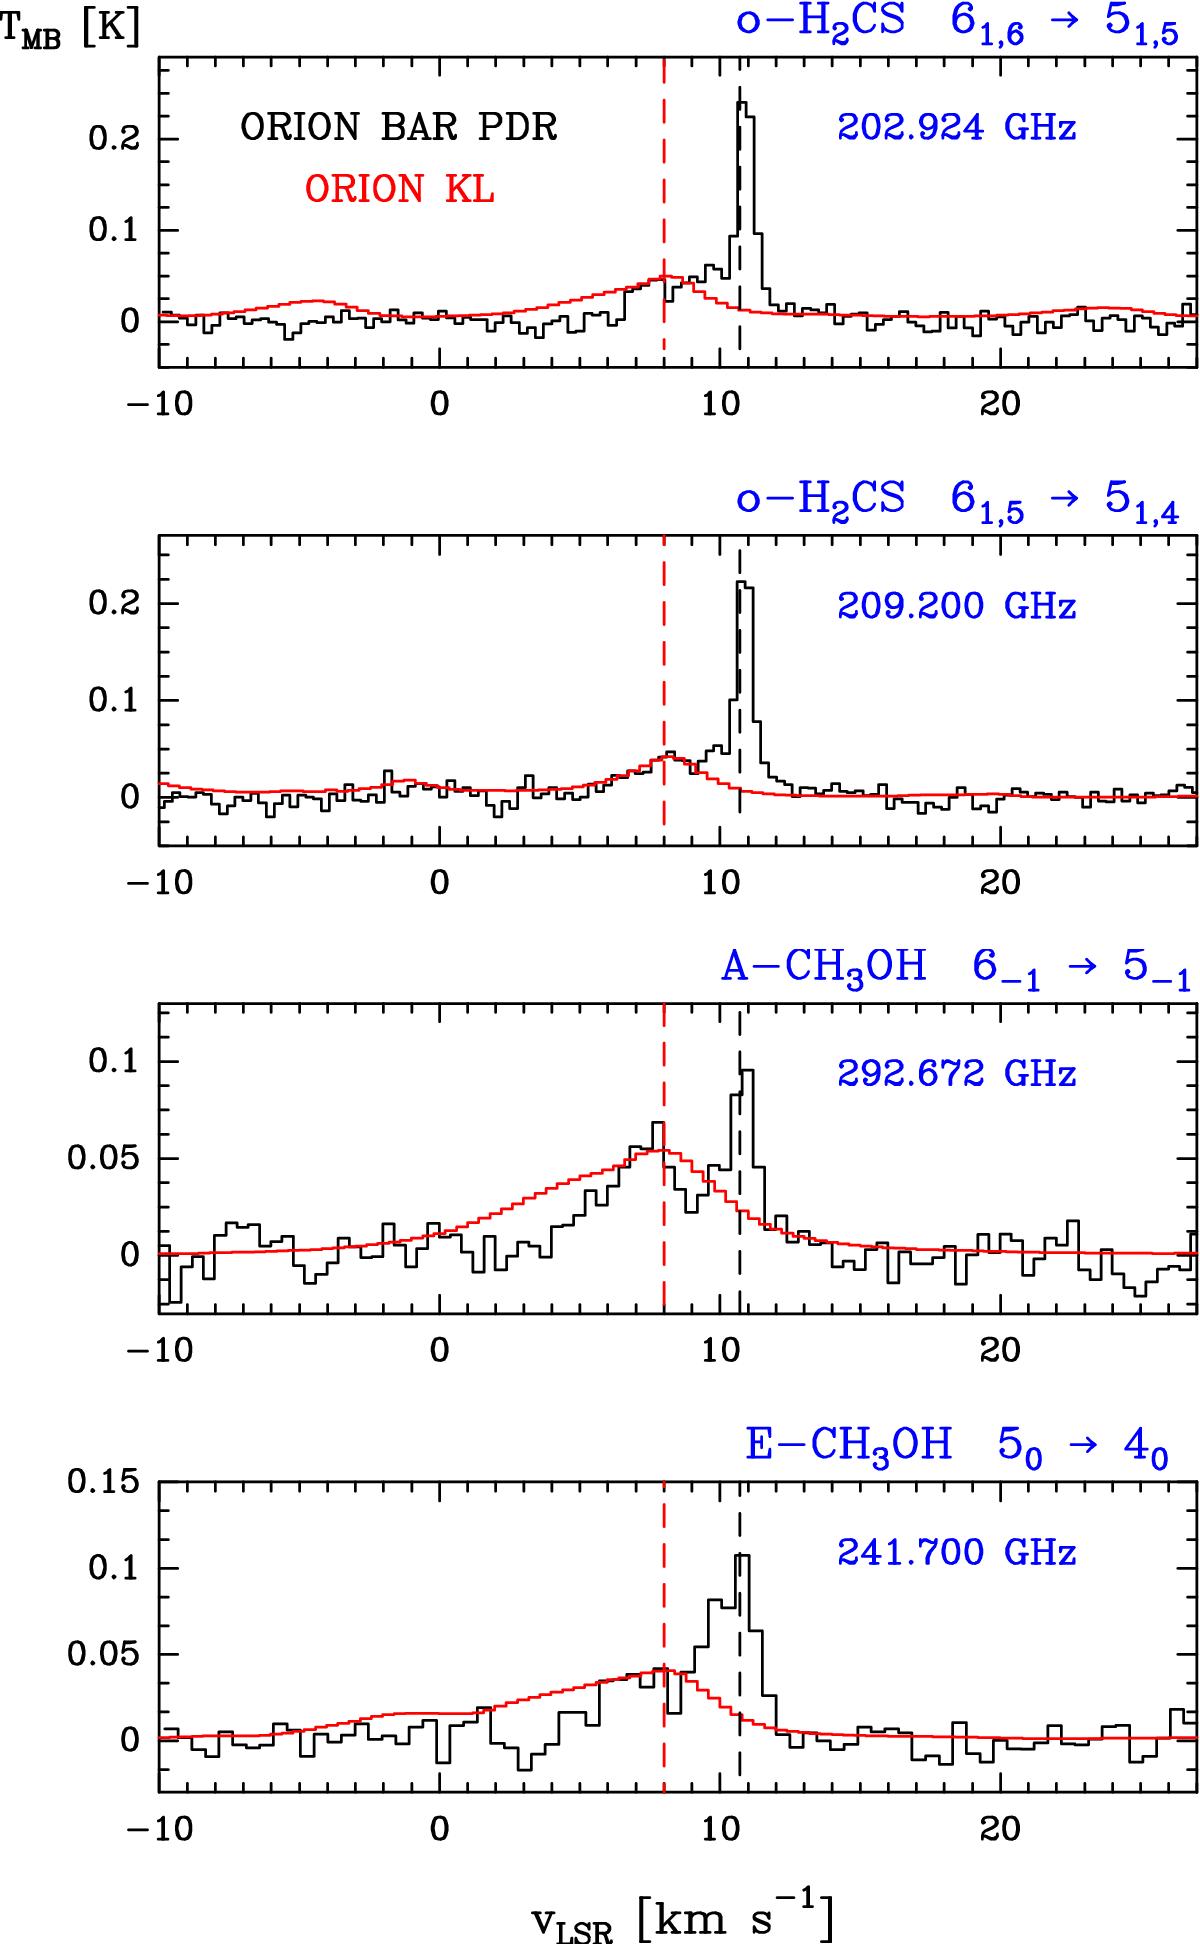
Orion Bar spectra (black) at different frequencies in the 1 mm range. For each line, the spectrum towards Orion BN/KL is also shown in red (Tercero et al. 2010, 2015). The CH3OH spectra towards Orion BN/KL have been divided by ~400, and the H2CS spectra by ~200. The black and red dashed lines indicate the LSR velocity of the Orion Bar PDR (10.7 km s-1) and Orion extended ridge and/or south hot core (~8 km s-1, see e.g. Cernicharo et al. 2016), respectively.
Current usage metrics show cumulative count of Article Views (full-text article views including HTML views, PDF and ePub downloads, according to the available data) and Abstracts Views on Vision4Press platform.
Data correspond to usage on the plateform after 2015. The current usage metrics is available 48-96 hours after online publication and is updated daily on week days.
Initial download of the metrics may take a while.